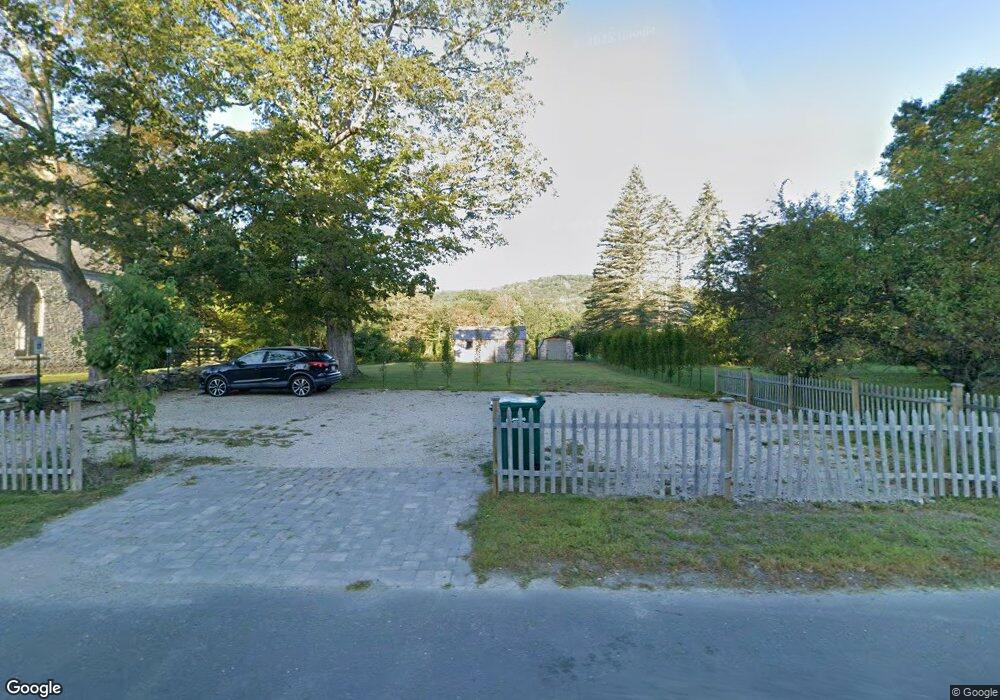
535 N Main St Lanesboro, MA 01237
Estimated Value: $84,088 - $169,000
1
Bed
1
Bath
528
Sq Ft
$206/Sq Ft
Est. Value
About This Home
This home is located at 535 N Main St, Lanesboro, MA 01237 and is currently estimated at $108,522, approximately $205 per square foot. 535 N Main St is a home located in Berkshire County with nearby schools including Lanesborough Elementary School and Mt. Greylock Regional High School.
Ownership History
Date
Name
Owned For
Owner Type
Purchase Details
Closed on
Mar 9, 2022
Sold by
Purkayastha Ian
Bought by
Purkayastha Ian and Lowe Jane
Current Estimated Value
Purchase Details
Closed on
Feb 14, 2022
Sold by
Purkayastha Abhijeet and Purkayastha Lisa P
Bought by
Purkayastha Ian
Purchase Details
Closed on
Jun 29, 2021
Sold by
Bailey Bruce L Est and Spring
Bought by
Purkayastha Abhijeet and Purkayastha Lisa P
Purchase Details
Closed on
Dec 14, 1988
Sold by
Hassan Boughton J
Bought by
Bailey Bruce L
Home Financials for this Owner
Home Financials are based on the most recent Mortgage that was taken out on this home.
Original Mortgage
$60,200
Interest Rate
10.07%
Mortgage Type
Purchase Money Mortgage
Create a Home Valuation Report for This Property
The Home Valuation Report is an in-depth analysis detailing your home's value as well as a comparison with similar homes in the area
Home Values in the Area
Average Home Value in this Area
Purchase History
| Date | Buyer | Sale Price | Title Company |
|---|---|---|---|
| Purkayastha Ian | -- | None Available | |
| Purkayastha Ian | -- | None Available | |
| Purkayastha Ian | -- | None Available | |
| Purkayastha Ian | -- | None Available | |
| Purkayastha Abhijeet | $65,000 | None Available | |
| Purkayastha Abhijeet | $65,000 | None Available | |
| Bailey Bruce L | $66,900 | -- |
Source: Public Records
Mortgage History
| Date | Status | Borrower | Loan Amount |
|---|---|---|---|
| Previous Owner | Bailey Bruce L | $56,000 | |
| Previous Owner | Bailey Bruce L | $60,200 |
Source: Public Records
Tax History Compared to Growth
Tax History
| Year | Tax Paid | Tax Assessment Tax Assessment Total Assessment is a certain percentage of the fair market value that is determined by local assessors to be the total taxable value of land and additions on the property. | Land | Improvement |
|---|---|---|---|---|
| 2025 | $863 | $51,600 | $51,600 | $0 |
| 2024 | $837 | $49,200 | $49,200 | $0 |
| 2023 | $2,078 | $117,600 | $49,300 | $68,300 |
| 2022 | $1,958 | $102,500 | $49,300 | $53,200 |
| 2021 | $1,994 | $98,300 | $49,300 | $49,000 |
| 2020 | $1,923 | $93,000 | $46,700 | $46,300 |
| 2019 | $2,105 | $93,000 | $46,700 | $46,300 |
| 2018 | $1,920 | $89,700 | $46,700 | $43,000 |
| 2017 | $1,776 | $85,000 | $42,200 | $42,800 |
| 2016 | $1,601 | $82,700 | $41,600 | $41,100 |
| 2015 | $1,564 | $82,400 | $41,600 | $40,800 |
Source: Public Records
Map
Nearby Homes
- 5 Victoria Ln
- 0 Bailey Rd
- 18 Billings St
- 0 Goodell Rd
- 40 Silver St
- 350 Old Cheshire Rd
- 20 Westview Rd
- 60 Old Cheshire Rd
- 112 Silver St
- 71 Miner Lots 2 and 3 Rd
- 66 Scott Rd
- 4 Upper Rd
- 0 Miner Rd
- 1 Old Orebed Rd
- 0 Old Ore Bed Rd Unit 246231
- 0 Old Ore Bed Rd Unit 246230
- 0 Old Ore Bed Rd Unit 246229
- 171 Bull Hill Rd
- Lot 4 Ore Bed Rd
- 8 Balance Rock Rd