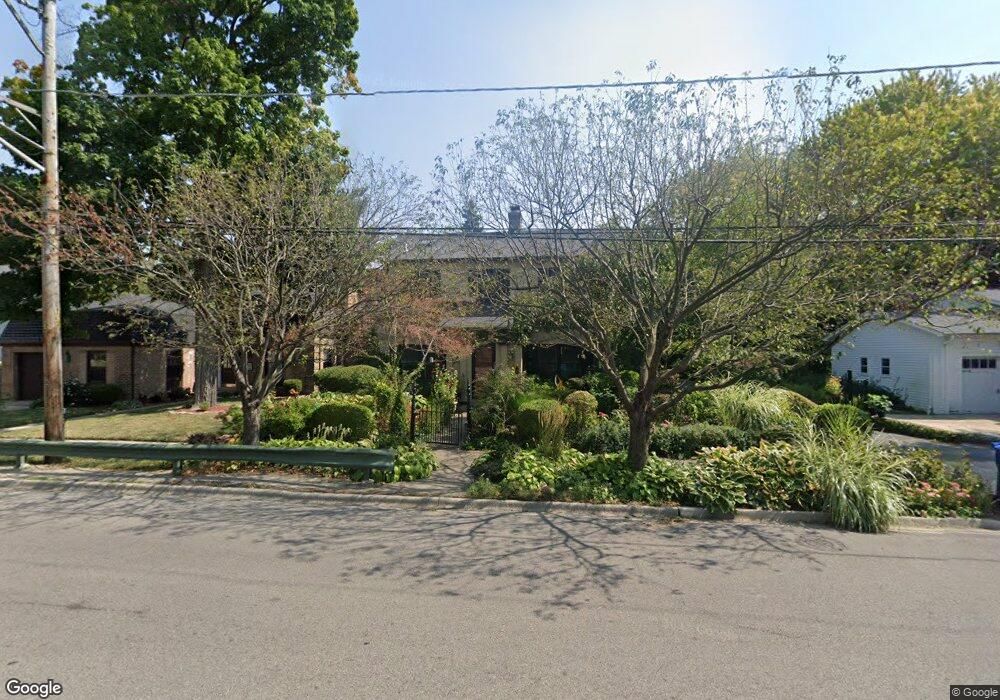
535 N Sheridan Rd Waukegan, IL 60085
Estimated Value: $254,000 - $320,000
3
Beds
2
Baths
1,576
Sq Ft
$180/Sq Ft
Est. Value
About This Home
This home is located at 535 N Sheridan Rd, Waukegan, IL 60085 and is currently estimated at $283,087, approximately $179 per square foot. 535 N Sheridan Rd is a home located in Lake County with nearby schools including Edith M Smith Middle School, Waukegan High School, and LEARN John & Kathy Schreiber Campus.
Ownership History
Date
Name
Owned For
Owner Type
Purchase Details
Closed on
Aug 18, 2006
Sold by
Cribb Sheri L
Bought by
Angarola Daniel R
Current Estimated Value
Home Financials for this Owner
Home Financials are based on the most recent Mortgage that was taken out on this home.
Original Mortgage
$140,000
Interest Rate
6.77%
Mortgage Type
Purchase Money Mortgage
Purchase Details
Closed on
Oct 10, 2003
Sold by
Jerdee Adolph S and Jerdee Rojfann
Bought by
Cribb Sheri L
Home Financials for this Owner
Home Financials are based on the most recent Mortgage that was taken out on this home.
Original Mortgage
$115,000
Interest Rate
6.04%
Mortgage Type
Purchase Money Mortgage
Purchase Details
Closed on
Oct 23, 1996
Sold by
Jerdee Adolph S and Jerdee Rosean
Bought by
Jerdee Adolph S and Jerdee Roseann
Create a Home Valuation Report for This Property
The Home Valuation Report is an in-depth analysis detailing your home's value as well as a comparison with similar homes in the area
Home Values in the Area
Average Home Value in this Area
Purchase History
| Date | Buyer | Sale Price | Title Company |
|---|---|---|---|
| Angarola Daniel R | $315,000 | Attorneys Title Guaranty Fun | |
| Cribb Sheri L | $230,000 | -- | |
| Jerdee Adolph S | -- | -- |
Source: Public Records
Mortgage History
| Date | Status | Borrower | Loan Amount |
|---|---|---|---|
| Closed | Angarola Daniel R | $140,000 | |
| Previous Owner | Cribb Sheri L | $115,000 |
Source: Public Records
Tax History Compared to Growth
Tax History
| Year | Tax Paid | Tax Assessment Tax Assessment Total Assessment is a certain percentage of the fair market value that is determined by local assessors to be the total taxable value of land and additions on the property. | Land | Improvement |
|---|---|---|---|---|
| 2024 | $5,554 | $74,045 | $17,289 | $56,756 |
| 2023 | $6,057 | $66,901 | $15,621 | $51,280 |
| 2022 | $6,057 | $67,957 | $21,097 | $46,860 |
| 2021 | $6,164 | $65,120 | $20,799 | $44,321 |
| 2020 | $6,197 | $60,667 | $19,377 | $41,290 |
| 2019 | $6,184 | $55,592 | $17,756 | $37,836 |
| 2018 | $5,514 | $51,004 | $21,540 | $29,464 |
| 2017 | $5,565 | $45,124 | $19,057 | $26,067 |
| 2016 | $5,132 | $39,211 | $16,560 | $22,651 |
| 2015 | $4,915 | $35,094 | $14,821 | $20,273 |
| 2014 | $5,816 | $39,911 | $9,469 | $30,442 |
| 2012 | $5,754 | $43,241 | $10,260 | $32,981 |
Source: Public Records
Map
Nearby Homes
- 611 N Genesee St
- 723 N County St
- 325 4th St
- 222 Grand Ave
- 452 North Ave
- 415 W Ridgeland Ave
- 702 Franklin St
- 522 N Poplar St
- 428 N Poplar St
- 620 N Poplar St
- 511 Chestnut St
- 918 N Ash St
- 1110 N Ash St
- 1122 N Ash St
- 28 N Saint James St
- 613 Washington St
- 557 W Water St
- 917 N Linden Ave
- 1109 Massena Ave
- 610 Bluff St
- 601 N Sheridan Rd
- 527 N Sheridan Rd
- 605 N Sheridan Rd
- 609 N Sheridan Rd
- 523 N Sheridan Rd
- 532 N Sheridan Rd
- 606 N Sheridan Rd
- 526 N Sheridan Rd
- 610 N Sheridan Rd
- 610 N Sheridan Rd Unit 1
- 515 N Sheridan Rd
- 616 N Sheridan Rd
- 619 N Sheridan Rd
- 127 Franklin St
- 603 N Genesee St
- 518 N Sheridan Rd
- 607 N Genesee St
- 509 N Sheridan Rd
- 523 N Genesee St