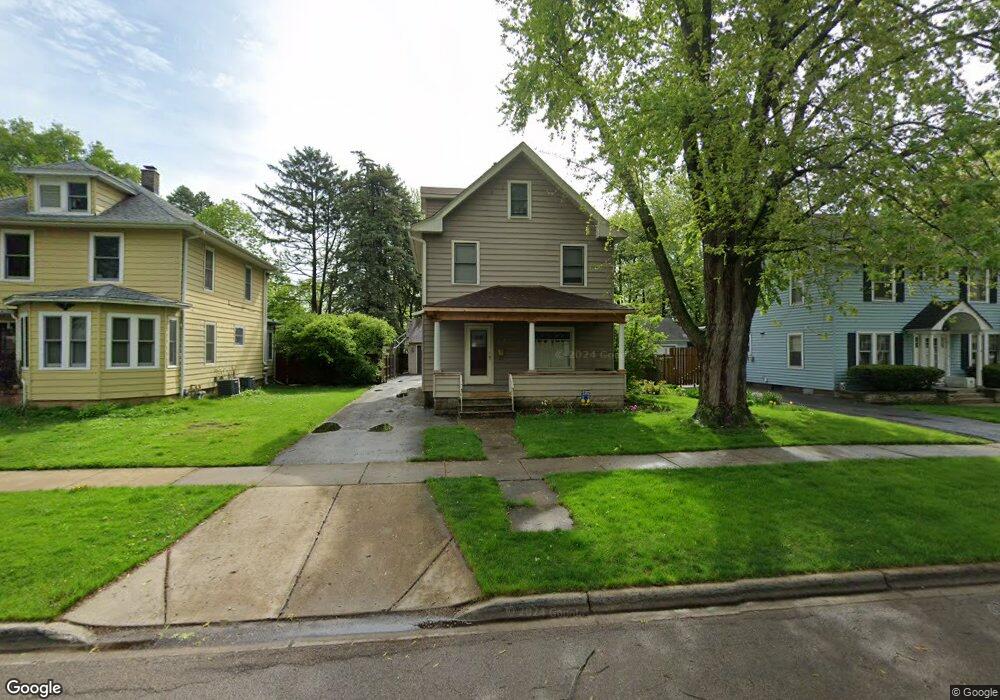
535 Palace St Aurora, IL 60506
Near West Galena NeighborhoodEstimated Value: $274,000 - $299,000
5
Beds
1
Bath
1,548
Sq Ft
$186/Sq Ft
Est. Value
About This Home
This home is located at 535 Palace St, Aurora, IL 60506 and is currently estimated at $288,600, approximately $186 per square foot. 535 Palace St is a home located in Kane County with nearby schools including Hill Elementary School, Herget Middle School, and West Aurora High School.
Ownership History
Date
Name
Owned For
Owner Type
Purchase Details
Closed on
Dec 29, 2003
Sold by
Bennett Doug
Bought by
Hanson Matthew
Current Estimated Value
Home Financials for this Owner
Home Financials are based on the most recent Mortgage that was taken out on this home.
Original Mortgage
$159,600
Outstanding Balance
$76,446
Interest Rate
6.25%
Mortgage Type
Purchase Money Mortgage
Estimated Equity
$212,154
Purchase Details
Closed on
Jul 31, 2003
Sold by
Francis Terry L
Bought by
Bennett Doug and Gmac Mortgage Corp
Create a Home Valuation Report for This Property
The Home Valuation Report is an in-depth analysis detailing your home's value as well as a comparison with similar homes in the area
Home Values in the Area
Average Home Value in this Area
Purchase History
| Date | Buyer | Sale Price | Title Company |
|---|---|---|---|
| Hanson Matthew | $168,000 | First American Title | |
| Bennett Doug | -- | -- |
Source: Public Records
Mortgage History
| Date | Status | Borrower | Loan Amount |
|---|---|---|---|
| Open | Hanson Matthew | $159,600 |
Source: Public Records
Tax History
| Year | Tax Paid | Tax Assessment Tax Assessment Total Assessment is a certain percentage of the fair market value that is determined by local assessors to be the total taxable value of land and additions on the property. | Land | Improvement |
|---|---|---|---|---|
| 2024 | $5,393 | $75,392 | $9,545 | $65,847 |
| 2023 | $5,141 | $67,362 | $8,528 | $58,834 |
| 2022 | $4,966 | $61,462 | $7,781 | $53,681 |
| 2021 | $4,737 | $57,222 | $7,244 | $49,978 |
| 2020 | $4,472 | $53,151 | $6,729 | $46,422 |
| 2019 | $4,344 | $49,828 | $6,235 | $43,593 |
| 2018 | $4,113 | $46,612 | $5,767 | $40,845 |
| 2017 | $3,861 | $42,946 | $5,314 | $37,632 |
| 2016 | $4,258 | $39,448 | $5,061 | $34,387 |
| 2015 | -- | $34,577 | $4,352 | $30,225 |
| 2014 | -- | $34,193 | $4,186 | $30,007 |
| 2013 | -- | $35,555 | $4,126 | $31,429 |
Source: Public Records
Map
Nearby Homes
- 231-233 Williams St
- 357 W Park Ave
- 418 W Illinois Ave
- 222 Grand Ave
- 371 Cedar St
- 519 N View St
- 603 N May St
- 14-18 N Lake St
- 20-22 N Locust St
- 359 W Galena Blvd
- 544 Charles St
- 500 California Ave
- 256 W Downer Place
- 932 W New York St
- 388 Manor Place
- 773 Aurora Ave
- 689 N Lincoln Ave
- 450 W Downer Place Unit 4C
- 138 Woodlawn Ave
- 338 Lakelawn Blvd
Your Personal Tour Guide
Ask me questions while you tour the home.