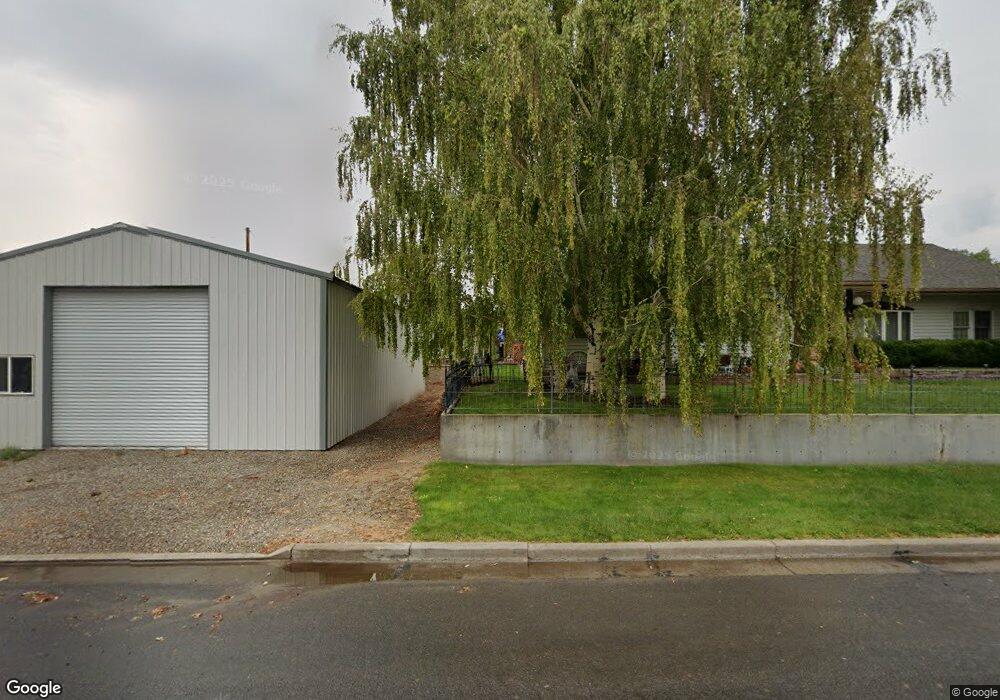
535 Pavilion St Winnemucca, NV 89445
Estimated Value: $394,000 - $494,000
4
Beds
2
Baths
2,742
Sq Ft
$157/Sq Ft
Est. Value
About This Home
This home is located at 535 Pavilion St, Winnemucca, NV 89445 and is currently estimated at $430,440, approximately $156 per square foot. 535 Pavilion St is a home located in Humboldt County with nearby schools including Sonoma Heights Elementary School, Winnemucca Junior High School, and French Ford Middle School.
Ownership History
Date
Name
Owned For
Owner Type
Purchase Details
Closed on
Feb 20, 2015
Sold by
Phillips Sandra P
Bought by
Hunewill Loren E and Phillips Hunewill Tonya
Current Estimated Value
Purchase Details
Closed on
Jan 14, 2006
Sold by
Phillips James W
Bought by
Phillips James W and Phillips Sandra P
Create a Home Valuation Report for This Property
The Home Valuation Report is an in-depth analysis detailing your home's value as well as a comparison with similar homes in the area
Home Values in the Area
Average Home Value in this Area
Purchase History
| Date | Buyer | Sale Price | Title Company |
|---|---|---|---|
| Hunewill Loren E | -- | None Available | |
| Phillips James W | -- | None Available |
Source: Public Records
Tax History Compared to Growth
Tax History
| Year | Tax Paid | Tax Assessment Tax Assessment Total Assessment is a certain percentage of the fair market value that is determined by local assessors to be the total taxable value of land and additions on the property. | Land | Improvement |
|---|---|---|---|---|
| 2025 | $1,808 | $59,344 | $14,175 | $45,169 |
| 2024 | $1,715 | $59,035 | $14,175 | $44,860 |
| 2023 | $1,715 | $55,144 | $14,175 | $40,969 |
| 2022 | $1,485 | $48,389 | $14,175 | $34,214 |
| 2021 | $1,383 | $47,471 | $14,175 | $33,296 |
| 2020 | $1,326 | $40,888 | $7,525 | $33,363 |
| 2019 | $1,284 | $37,071 | $7,525 | $29,546 |
| 2018 | $1,246 | $35,887 | $7,525 | $28,362 |
| 2017 | $1,237 | $35,598 | $7,525 | $28,073 |
| 2016 | $1,282 | $37,616 | $7,525 | $30,091 |
| 2015 | $1,317 | $38,090 | $7,525 | $30,565 |
| 2014 | $1,317 | $38,393 | $7,525 | $30,868 |
Source: Public Records
Map
Nearby Homes