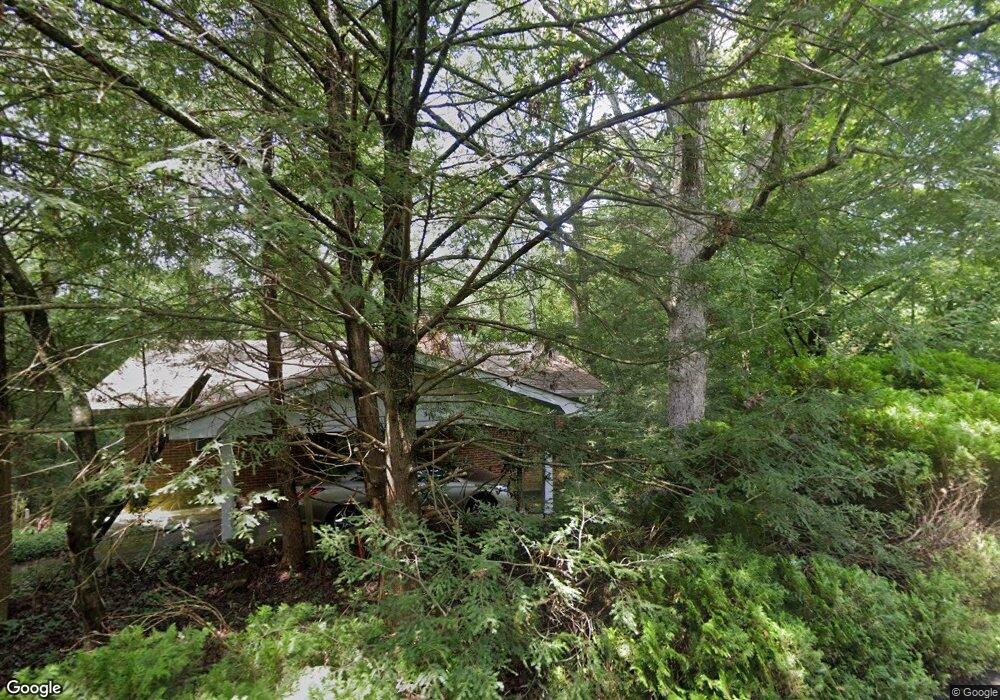
535 Riverbend Cir Ellijay, GA 30536
Estimated Value: $311,807 - $618,000
3
Beds
2
Baths
1,644
Sq Ft
$255/Sq Ft
Est. Value
About This Home
This home is located at 535 Riverbend Cir, Ellijay, GA 30536 and is currently estimated at $419,952, approximately $255 per square foot. 535 Riverbend Cir is a home located in Gilmer County with nearby schools including Ellijay Elementary School, Clear Creek Elementary School, and Clear Creek Middle School.
Ownership History
Date
Name
Owned For
Owner Type
Purchase Details
Closed on
Nov 1, 1969
Bought by
Keener William P Mrs
Current Estimated Value
Create a Home Valuation Report for This Property
The Home Valuation Report is an in-depth analysis detailing your home's value as well as a comparison with similar homes in the area
Home Values in the Area
Average Home Value in this Area
Purchase History
| Date | Buyer | Sale Price | Title Company |
|---|---|---|---|
| Keener William P Mrs | -- | -- |
Source: Public Records
Tax History Compared to Growth
Tax History
| Year | Tax Paid | Tax Assessment Tax Assessment Total Assessment is a certain percentage of the fair market value that is determined by local assessors to be the total taxable value of land and additions on the property. | Land | Improvement |
|---|---|---|---|---|
| 2024 | $190 | $75,556 | $11,400 | $64,156 |
| 2023 | $243 | $77,372 | $5,600 | $71,772 |
| 2022 | $216 | $64,196 | $5,600 | $58,596 |
| 2021 | $240 | $52,156 | $5,600 | $46,556 |
| 2020 | $268 | $45,052 | $5,600 | $39,452 |
| 2019 | $280 | $45,052 | $5,600 | $39,452 |
| 2018 | $231 | $45,052 | $5,600 | $39,452 |
| 2017 | $231 | $35,992 | $5,600 | $30,392 |
| 2016 | $232 | $36,936 | $5,600 | $31,336 |
| 2015 | $220 | $37,496 | $5,600 | $31,896 |
| 2014 | $215 | $30,140 | $5,600 | $24,540 |
| 2013 | -- | $29,820 | $5,600 | $24,220 |
Source: Public Records
Map
Nearby Homes
- LOT 6 Riverfront Dr
- LOT 3 Riverfront Dr
- LOT 4 Riverfront Dr
- LOT 5 Riverfront Dr
- LOT 17 Misty Mountain Trail
- 0 Aspen Ave Unit 10501189
- 0 Aspen Ave Unit 1025047
- 0 Highway 52 W Unit 10598315
- 0 Highway 52 W Unit 7642027
- 220 Oak Ridge Ln
- 71 Black Walnut Place
- 269 Old Orchard Rd
- LOT 3 Ridgehaven Trail
- Lots 1-3 Ridgehaven Trail
- 0 Yukon Rd Unit 10649657
- 645 Riverside Dr
- 118 E Oak St
- 31 Willow St
- 3048 E Highway 52
- 80 Riverbend Cir
- 80 River Bend Cir
- 126 Riverbend Cir
- 2971 Highway 52 E
- 467 Riverbend Cir
- 3025 Highway 52 E
- L 8 Toccoa Riverbend Estate
- 3025 Georgia 52
- 60 Riverbend Cir
- 3043 Highway 52 E
- 35 Riverbend Terrace
- 425 Riverbend Cir
- 222 Riverbend Cir
- 222 Riverbend Cir
- 3207 Highway 52 E
- 395 Riverbend Cir
- 3128 Highway 52 E
- 2847 Highway 52 E
- 250 Riverbend Cir