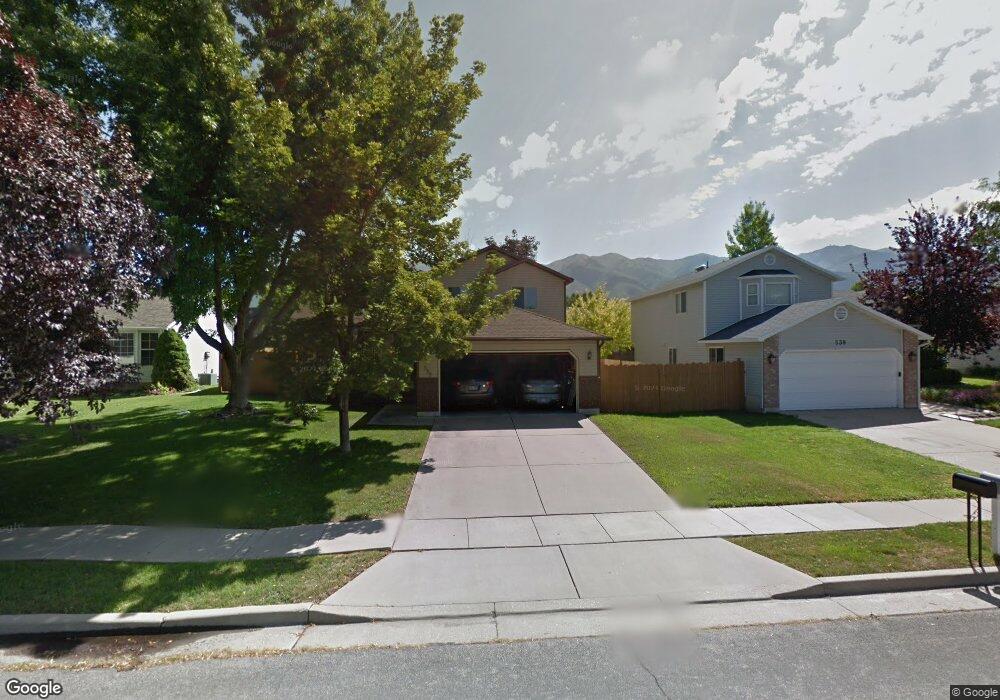
535 S 900 E Layton, UT 84041
Estimated Value: $473,000 - $522,000
4
Beds
2
Baths
1,907
Sq Ft
$262/Sq Ft
Est. Value
About This Home
This home is located at 535 S 900 E, Layton, UT 84041 and is currently estimated at $499,108, approximately $261 per square foot. 535 S 900 E is a home located in Davis County with nearby schools including Creekside Elementary School, Fairfield Junior High School, and Davis High School.
Ownership History
Date
Name
Owned For
Owner Type
Purchase Details
Closed on
Oct 30, 2024
Sold by
Johnson Living Trust and Johnson Richard L
Bought by
Christensen Clark and Christensen Rachel
Current Estimated Value
Home Financials for this Owner
Home Financials are based on the most recent Mortgage that was taken out on this home.
Original Mortgage
$475,000
Outstanding Balance
$469,756
Interest Rate
6.09%
Mortgage Type
New Conventional
Estimated Equity
$29,352
Purchase Details
Closed on
Oct 2, 2020
Sold by
Johnson Richard L and Johnson Kortney Sue
Bought by
Johnson Richard L and Johnson Kortney Sue
Purchase Details
Closed on
Oct 18, 2016
Sold by
Tyler Danielle and Tyler Alex
Bought by
Johnson Richard and Johnson Kortney
Purchase Details
Closed on
May 2, 2013
Sold by
Berrett Frank K and Berrett Arlene D
Bought by
Tyler Danielle and Tyler Alex
Home Financials for this Owner
Home Financials are based on the most recent Mortgage that was taken out on this home.
Original Mortgage
$174,600
Interest Rate
3.51%
Mortgage Type
New Conventional
Create a Home Valuation Report for This Property
The Home Valuation Report is an in-depth analysis detailing your home's value as well as a comparison with similar homes in the area
Home Values in the Area
Average Home Value in this Area
Purchase History
| Date | Buyer | Sale Price | Title Company |
|---|---|---|---|
| Christensen Clark | -- | Invictus Title | |
| Johnson Richard L | -- | None Available | |
| Johnson Richard | -- | Us Title | |
| Tyler Danielle | -- | Backman Title Servic |
Source: Public Records
Mortgage History
| Date | Status | Borrower | Loan Amount |
|---|---|---|---|
| Open | Christensen Clark | $475,000 | |
| Previous Owner | Tyler Danielle | $174,600 |
Source: Public Records
Tax History
| Year | Tax Paid | Tax Assessment Tax Assessment Total Assessment is a certain percentage of the fair market value that is determined by local assessors to be the total taxable value of land and additions on the property. | Land | Improvement |
|---|---|---|---|---|
| 2025 | $2,169 | $227,700 | $89,910 | $137,790 |
| 2024 | $2,018 | $213,400 | $105,447 | $107,953 |
| 2023 | $2,012 | $375,000 | $131,892 | $243,108 |
| 2022 | $2,103 | $212,850 | $67,764 | $145,086 |
| 2021 | $1,934 | $292,000 | $90,054 | $201,946 |
| 2020 | $1,747 | $253,000 | $77,849 | $175,151 |
| 2019 | $1,720 | $244,000 | $75,880 | $168,120 |
| 2018 | $1,559 | $222,000 | $75,880 | $146,120 |
| 2016 | $1,438 | $105,600 | $22,884 | $82,716 |
| 2015 | $1,383 | $96,415 | $22,884 | $73,531 |
| 2014 | $1,402 | $99,998 | $22,884 | $77,114 |
| 2013 | -- | $90,118 | $19,034 | $71,084 |
Source: Public Records
Map
Nearby Homes
- 679 S Clearwater Falls Dr
- 1137 Holmes Creek Ln
- 772 N Crimson Ln
- 1368 E 275 S
- 680 N Main St Trlr E-11
- 617 E 405 S
- 766 N Stonne Ln
- 706 S 600 E
- 504 E Alice Way
- 895 S Main St Unit E
- 623 E Clearwater Dr Unit 15
- 811 S Main St
- 464 E Alice Way
- 905 S Main St Unit G
- 917 S Main St Unit H
- 9 Colonial Ave
- 680 N Main St Unit B13
- 680 N Main St Unit D14
- 524 Hyde Park Ln
- 389 Morgan St
Your Personal Tour Guide
Ask me questions while you tour the home.