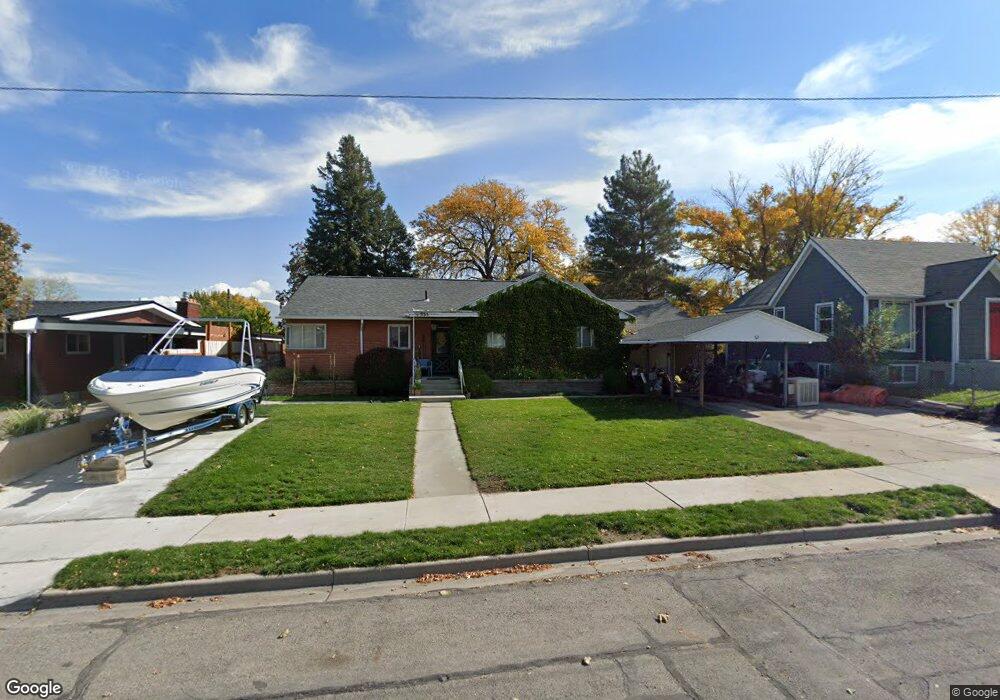
535 S Main St Payson, UT 84651
Estimated Value: $441,000 - $473,000
3
Beds
2
Baths
1,266
Sq Ft
$357/Sq Ft
Est. Value
About This Home
This home is located at 535 S Main St, Payson, UT 84651 and is currently estimated at $451,904, approximately $356 per square foot. 535 S Main St is a home located in Utah County with nearby schools including Park View Elementary, Payson Junior High School, and Payson High School.
Ownership History
Date
Name
Owned For
Owner Type
Purchase Details
Closed on
Jul 20, 2020
Sold by
Broadbent Charles R and Broadbent Mari D
Bought by
Broadbent Charles R
Current Estimated Value
Home Financials for this Owner
Home Financials are based on the most recent Mortgage that was taken out on this home.
Original Mortgage
$92,028
Outstanding Balance
$53,741
Interest Rate
3.1%
Mortgage Type
New Conventional
Estimated Equity
$398,163
Purchase Details
Closed on
Dec 23, 2009
Sold by
Broadbent Charles Richard
Bought by
Broadbent Charles R and Broadbent Mari D
Home Financials for this Owner
Home Financials are based on the most recent Mortgage that was taken out on this home.
Original Mortgage
$83,000
Interest Rate
4.88%
Mortgage Type
New Conventional
Purchase Details
Closed on
Jan 26, 2004
Sold by
Broadbent Charles Leroy and Brady Mary Ann
Bought by
Broadbent Charles Richard
Home Financials for this Owner
Home Financials are based on the most recent Mortgage that was taken out on this home.
Original Mortgage
$87,300
Interest Rate
5.86%
Mortgage Type
New Conventional
Create a Home Valuation Report for This Property
The Home Valuation Report is an in-depth analysis detailing your home's value as well as a comparison with similar homes in the area
Home Values in the Area
Average Home Value in this Area
Purchase History
| Date | Buyer | Sale Price | Title Company |
|---|---|---|---|
| Broadbent Charles R | -- | First American Title | |
| Broadbent Charles R | -- | Morgan Title & Escrow Inc | |
| Broadbent Charles Richard | -- | Metro National Title |
Source: Public Records
Mortgage History
| Date | Status | Borrower | Loan Amount |
|---|---|---|---|
| Open | Broadbent Charles R | $92,028 | |
| Closed | Broadbent Charles R | $83,000 | |
| Closed | Broadbent Charles Richard | $87,300 |
Source: Public Records
Tax History
| Year | Tax Paid | Tax Assessment Tax Assessment Total Assessment is a certain percentage of the fair market value that is determined by local assessors to be the total taxable value of land and additions on the property. | Land | Improvement |
|---|---|---|---|---|
| 2025 | $1,006 | $231,440 | -- | -- |
| 2024 | $1,006 | $207,240 | $0 | $0 |
| 2023 | $2,028 | $206,910 | $0 | $0 |
| 2022 | $2,162 | $217,030 | $0 | $0 |
| 2021 | $1,798 | $289,500 | $96,800 | $192,700 |
| 2020 | $1,715 | $270,100 | $88,000 | $182,100 |
| 2019 | $1,474 | $238,000 | $76,000 | $162,000 |
| 2018 | $1,367 | $212,700 | $64,000 | $148,700 |
| 2017 | $1,254 | $104,995 | $0 | $0 |
| 2016 | $1,126 | $93,665 | $0 | $0 |
Source: Public Records
Map
Nearby Homes
Your Personal Tour Guide
Ask me questions while you tour the home.