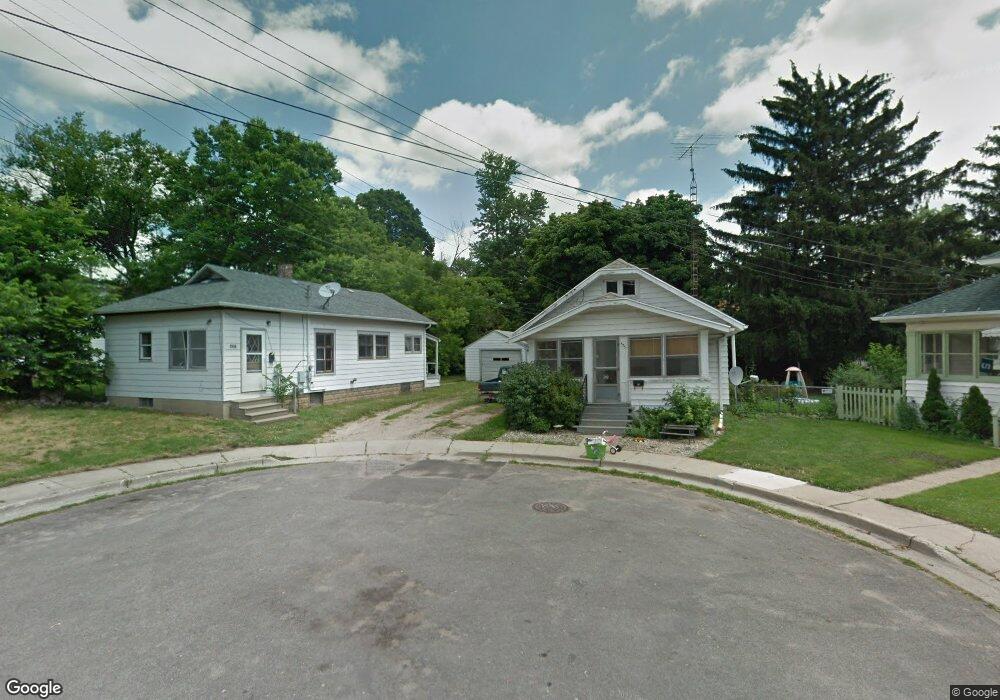
535 Torrence Ct Lansing, MI 48910
Fabulous Acres NeighborhoodEstimated Value: $78,000 - $104,000
2
Beds
1
Bath
748
Sq Ft
$119/Sq Ft
Est. Value
About This Home
This home is located at 535 Torrence Ct, Lansing, MI 48910 and is currently estimated at $89,333, approximately $119 per square foot. 535 Torrence Ct is a home located in Ingham County with nearby schools including Lyons Elementary School, Pattengill Academy, and Eastern High School.
Ownership History
Date
Name
Owned For
Owner Type
Purchase Details
Closed on
Mar 22, 2024
Sold by
Yaqoub Shahem
Bought by
Boik Alycia
Current Estimated Value
Purchase Details
Closed on
Nov 10, 2022
Sold by
Ingham County Land Bank Fast Track Autho
Bought by
Yaqoub Shahem
Purchase Details
Closed on
Dec 14, 2016
Sold by
Ingham County
Bought by
Ingham County Land Bank Fast Track Autho
Purchase Details
Closed on
Dec 13, 2016
Sold by
Schertzing Eric
Bought by
County Of Ingham
Purchase Details
Closed on
Feb 15, 2006
Sold by
Kuntz Frances Colleen
Bought by
Stephenson Peggy
Home Financials for this Owner
Home Financials are based on the most recent Mortgage that was taken out on this home.
Original Mortgage
$50,000
Interest Rate
9.69%
Mortgage Type
Purchase Money Mortgage
Create a Home Valuation Report for This Property
The Home Valuation Report is an in-depth analysis detailing your home's value as well as a comparison with similar homes in the area
Home Values in the Area
Average Home Value in this Area
Purchase History
| Date | Buyer | Sale Price | Title Company |
|---|---|---|---|
| Boik Alycia | -- | Transnation Title | |
| Yaqoub Shahem | $1,000 | None Listed On Document | |
| Ingham County Land Bank Fast Track Autho | -- | None Available | |
| County Of Ingham | -- | None Available | |
| Stephenson Peggy | $50,000 | None Available |
Source: Public Records
Mortgage History
| Date | Status | Borrower | Loan Amount |
|---|---|---|---|
| Previous Owner | Stephenson Peggy | $50,000 |
Source: Public Records
Tax History
| Year | Tax Paid | Tax Assessment Tax Assessment Total Assessment is a certain percentage of the fair market value that is determined by local assessors to be the total taxable value of land and additions on the property. | Land | Improvement |
|---|---|---|---|---|
| 2025 | $177 | $2,800 | $2,800 | $0 |
| 2024 | $1 | $2,800 | $2,800 | $0 |
| 2023 | $223 | $2,800 | $2,800 | $0 |
| 2022 | $0 | $0 | $0 | $0 |
| 2021 | $0 | $0 | $0 | $0 |
| 2020 | $0 | $0 | $0 | $0 |
| 2019 | $0 | $0 | $0 | $0 |
| 2018 | $0 | $0 | $0 | $0 |
| 2017 | $0 | $0 | $0 | $0 |
| 2016 | $1,946 | $16,000 | $2,200 | $13,800 |
| 2015 | $1,946 | $15,600 | $4,336 | $11,264 |
| 2014 | $1,946 | $15,600 | $3,295 | $12,305 |
Source: Public Records
Map
Nearby Homes
- 1515 Linval St
- 1535 Linval St
- 506 Christiancy St
- 534 Isbell St
- 616 Isbell St
- 1437 Ada St
- 1731 Lyons Ave
- 1731 Herbert St
- 147 Isbell St
- 1423 Pontiac St
- 315 E Mount Hope Ave
- 1807 Teel Ave
- 704 Mckim Ave
- 2118 Roberts Ln
- 1917 Teel Ave
- 1408 Reo Ave
- 218 E Elm St
- 1406 Reo Ave
- 139 Woodlawn Ave
- 1501 Shubel Ave
Your Personal Tour Guide
Ask me questions while you tour the home.