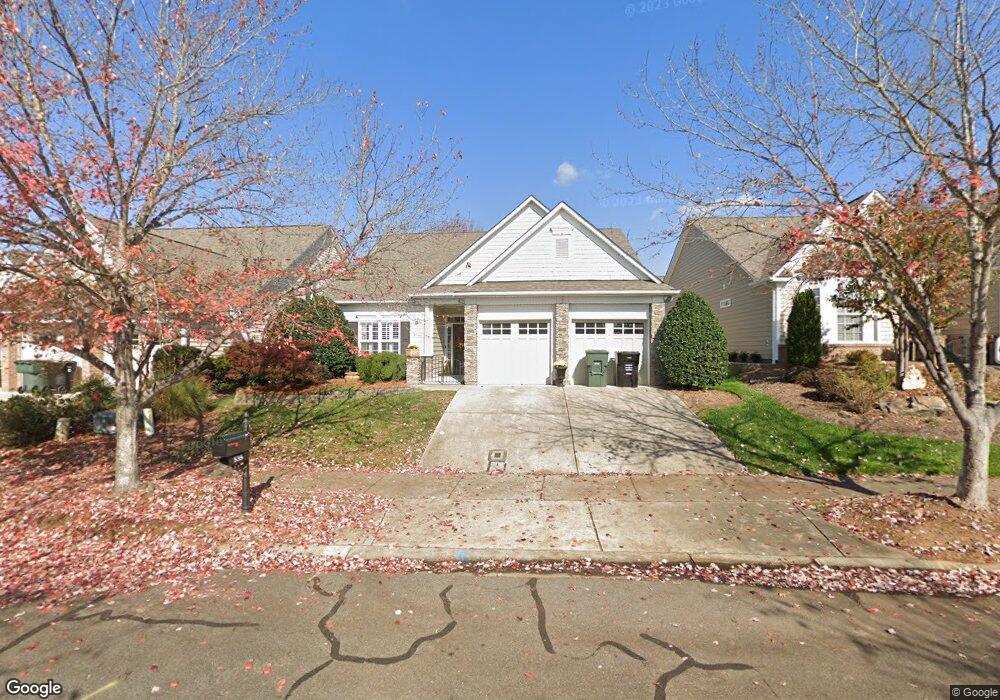
535 Wellbourne Ct NW Concord, NC 28027
Estimated Value: $269,000 - $466,000
3
Beds
2
Baths
1,947
Sq Ft
$199/Sq Ft
Est. Value
About This Home
This home is located at 535 Wellbourne Ct NW, Concord, NC 28027 and is currently estimated at $387,000, approximately $198 per square foot. 535 Wellbourne Ct NW is a home located in Cabarrus County with nearby schools including Weddington Hills Elementary School, Harold E. Winkler Middle School, and Dogwood Classical Academy.
Ownership History
Date
Name
Owned For
Owner Type
Purchase Details
Closed on
Jun 2, 2025
Sold by
Allen Jane J
Bought by
Dunagan Steven Harry and Dunagan Regina Allen
Current Estimated Value
Purchase Details
Closed on
Jun 27, 2014
Sold by
Mills Wesley W and Mills Shelly R
Bought by
Allen Francis E and Allen Jane J
Home Financials for this Owner
Home Financials are based on the most recent Mortgage that was taken out on this home.
Original Mortgage
$188,000
Interest Rate
4.23%
Mortgage Type
New Conventional
Purchase Details
Closed on
Nov 23, 2004
Sold by
Niblock Development Corp
Bought by
Mills Wesley W and Mills Shelly R
Home Financials for this Owner
Home Financials are based on the most recent Mortgage that was taken out on this home.
Original Mortgage
$145,000
Interest Rate
4.87%
Mortgage Type
Purchase Money Mortgage
Purchase Details
Closed on
Jul 23, 2004
Sold by
Laurel Park Development Llc
Bought by
Niblock Development Corp
Create a Home Valuation Report for This Property
The Home Valuation Report is an in-depth analysis detailing your home's value as well as a comparison with similar homes in the area
Home Values in the Area
Average Home Value in this Area
Purchase History
| Date | Buyer | Sale Price | Title Company |
|---|---|---|---|
| Dunagan Steven Harry | $242,000 | None Listed On Document | |
| Allen Francis E | $235,000 | None Available | |
| Mills Wesley W | $228,500 | -- | |
| Niblock Development Corp | $154,000 | -- |
Source: Public Records
Mortgage History
| Date | Status | Borrower | Loan Amount |
|---|---|---|---|
| Previous Owner | Allen Francis E | $188,000 | |
| Previous Owner | Mills Wesley W | $80,473 | |
| Previous Owner | Mills Wesley | $25,000 | |
| Previous Owner | Mills Wesley W | $145,000 |
Source: Public Records
Tax History Compared to Growth
Tax History
| Year | Tax Paid | Tax Assessment Tax Assessment Total Assessment is a certain percentage of the fair market value that is determined by local assessors to be the total taxable value of land and additions on the property. | Land | Improvement |
|---|---|---|---|---|
| 2025 | $3,974 | $399,010 | $85,000 | $314,010 |
| 2024 | $3,974 | $399,010 | $85,000 | $314,010 |
| 2023 | $3,553 | $291,210 | $55,000 | $236,210 |
| 2022 | $3,553 | $291,210 | $55,000 | $236,210 |
| 2021 | $3,553 | $291,210 | $55,000 | $236,210 |
| 2020 | $3,553 | $291,210 | $55,000 | $236,210 |
| 2019 | $3,009 | $246,670 | $47,000 | $199,670 |
| 2018 | $2,960 | $246,670 | $47,000 | $199,670 |
| 2017 | $2,911 | $246,670 | $47,000 | $199,670 |
| 2016 | $1,727 | $224,030 | $45,500 | $178,530 |
| 2015 | $2,644 | $224,030 | $45,500 | $178,530 |
| 2014 | $2,644 | $224,030 | $45,500 | $178,530 |
Source: Public Records
Map
Nearby Homes
- 518 Wellbourne Ct NW
- 542 Buffinton Ct NW
- 2635 Danbury Circle Dr NW
- 533 Montgrove Place NW
- 2676 Sunberry Ln NW
- 2567 Roswell Ct NW
- 578 Ambergate Place NW
- 557 Keystone Ct NW
- 2504 Fallbrook Place NW
- 551 Hemmings Place NW
- 561 Keystone Ct NW
- 2514 Mountain Laurel Ave NW
- 2652 Bedford Place NW
- 664 Summerford Ct NW
- 2695 Jameson Dr NW
- 4654 Habersham Ct NW
- 4909 Charmwood Ct NW
- 3724 Patricia Dr NW
- 1390 Lloyd Place NW
- 4940 Weddington Rd NW
- 531 Wellbourne Ct NW
- 539 Wellbourne Ct NW
- 554 Hamberton Ct NW
- 527 Wellbourne Ct NW
- 550 Hamberton Ct NW
- 558 Hamberton Ct NW
- 558 Hamberton Ct NW Unit 172
- 546 Hamberton Ct NW
- 523 Wellbourne Ct NW
- 532 Wellbourne Ct NW
- 538 Wellbourne Ct NW
- 542 Hamberton Ct NW
- 528 Wellbourne Ct NW
- 2561 Southberry Place NW
- 519 Wellbourne Ct NW
- 2557 Southberry Place NW
- 524 Wellbourne Ct NW
- 2565 Southberry Place NW
- 538 Hamberton Ct NW
- 2553 Southberry Place NW