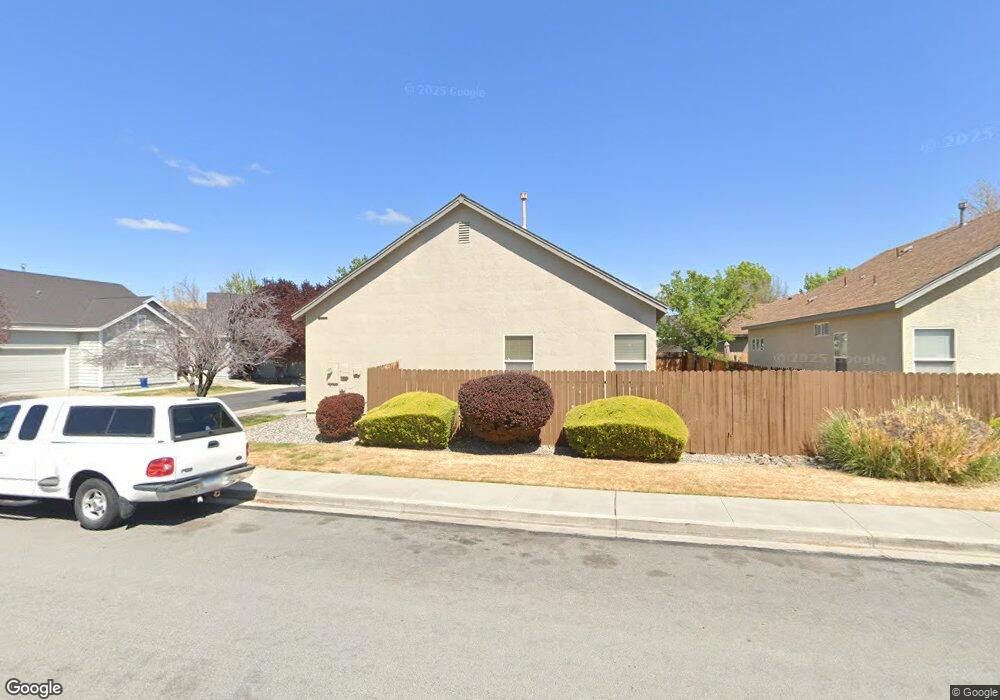
5350 Desert Peach Dr Unit 7 Sparks, NV 89436
Sparks Galleria NeighborhoodEstimated Value: $423,000 - $439,000
2
Beds
2
Baths
1,096
Sq Ft
$390/Sq Ft
Est. Value
About This Home
This home is located at 5350 Desert Peach Dr Unit 7, Sparks, NV 89436 and is currently estimated at $427,913, approximately $390 per square foot. 5350 Desert Peach Dr Unit 7 is a home located in Washoe County with nearby schools including Miguel Sepulveda Elementary School, Sky Ranch Middle School, and Edward C Reed High School.
Ownership History
Date
Name
Owned For
Owner Type
Purchase Details
Closed on
Jul 16, 2003
Sold by
Goff Bruce R
Bought by
Penalber Steve
Current Estimated Value
Home Financials for this Owner
Home Financials are based on the most recent Mortgage that was taken out on this home.
Original Mortgage
$138,000
Outstanding Balance
$58,096
Interest Rate
5.13%
Mortgage Type
Unknown
Estimated Equity
$369,817
Purchase Details
Closed on
Dec 27, 2000
Sold by
Sparks Development Llc
Bought by
Goff Bruce R
Home Financials for this Owner
Home Financials are based on the most recent Mortgage that was taken out on this home.
Original Mortgage
$126,250
Interest Rate
7.71%
Create a Home Valuation Report for This Property
The Home Valuation Report is an in-depth analysis detailing your home's value as well as a comparison with similar homes in the area
Home Values in the Area
Average Home Value in this Area
Purchase History
| Date | Buyer | Sale Price | Title Company |
|---|---|---|---|
| Penalber Steve | $172,500 | First Centennial Title Co | |
| Goff Bruce R | $134,500 | First American Title Co |
Source: Public Records
Mortgage History
| Date | Status | Borrower | Loan Amount |
|---|---|---|---|
| Open | Penalber Steve | $138,000 | |
| Previous Owner | Goff Bruce R | $126,250 | |
| Closed | Penalber Steve | $25,875 |
Source: Public Records
Tax History Compared to Growth
Tax History
| Year | Tax Paid | Tax Assessment Tax Assessment Total Assessment is a certain percentage of the fair market value that is determined by local assessors to be the total taxable value of land and additions on the property. | Land | Improvement |
|---|---|---|---|---|
| 2025 | $1,761 | $77,451 | $29,260 | $48,191 |
| 2024 | $1,761 | $75,241 | $26,600 | $48,641 |
| 2023 | $1,711 | $73,485 | $27,405 | $46,080 |
| 2022 | $1,660 | $62,502 | $24,115 | $38,387 |
| 2021 | $1,613 | $57,764 | $19,530 | $38,234 |
| 2020 | $1,573 | $57,971 | $19,635 | $38,336 |
| 2019 | $1,518 | $55,769 | $18,655 | $37,114 |
| 2018 | $1,473 | $49,476 | $13,090 | $36,386 |
| 2017 | $1,432 | $48,850 | $12,390 | $36,460 |
| 2016 | $1,394 | $49,164 | $11,165 | $37,999 |
| 2015 | $1,392 | $48,129 | $10,115 | $38,014 |
| 2014 | $1,354 | $44,842 | $8,260 | $36,582 |
| 2013 | -- | $37,682 | $7,105 | $30,577 |
Source: Public Records
Map
Nearby Homes
- 5049 Keams Ct
- 811 Pinchot Pass Ct Unit 5
- 801 Pinchot Pass Ct Unit 7
- 4950 San Diego Ct
- 5365 Ebbetts Pass Dr
- 2084 Great Bluffs Ln Unit Homesite 5132
- 2094 Great Bluffs Ln Unit Homesite 5133
- 7129 Singing Tree Rd Unit Homesite 5121
- 6835 Summit View Dr
- 601 W Equinox Peak Ct
- 601 W Equinox Peak Ct Unit Homesite 2030
- 6671 April St
- 1304 Lambrusca Dr
- 4956 Monrovia Dr
- 1215 Ebling Dr
- 5105 Santa Anita Dr
- 5651 Hunting Creek Way
- 6835 Pah Rah Dr
- 6920 Pah Rah Dr
- 4748 Pradera St
- 5354 Desert Peach Dr
- 5346 Desert Peach Dr
- 5362 Desert Peach Dr
- 5358 Desert Peach Dr Unit 7
- 5342 Desert Peach Dr
- 5349 Desert Peach Dr
- 919 Ephedra Ln
- 5345 Desert Peach Dr
- 5361 Desert Peach Dr
- 937 Ephedra Ln
- 5366 Desert Peach Dr
- 5334 Desert Peach Dr
- 913 Ephedra Ln
- 5338 Desert Peach Dr
- 5370 Desert Peach Dr
- 5353 Desert Peach Dr
- 5365 Desert Peach Dr
- 943 Ephedra Ln
- 5333 Desert Peach Dr
- 925 Ephedra Ln