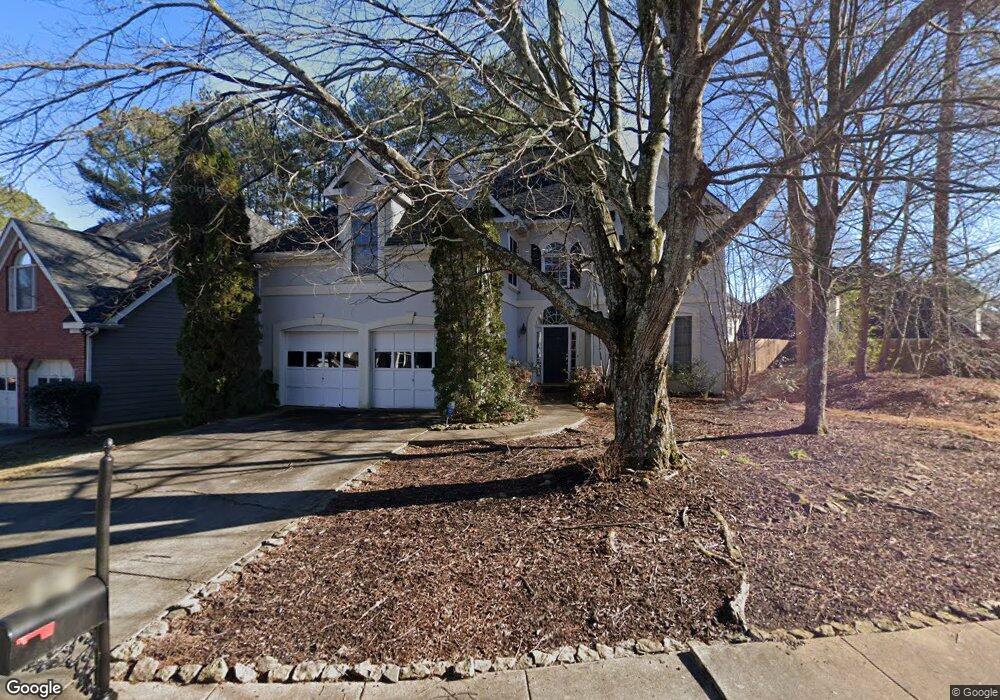
5350 Wyntree Ct Unit 1 Norcross, GA 30071
Estimated Value: $532,349 - $589,000
4
Beds
3
Baths
2,391
Sq Ft
$235/Sq Ft
Est. Value
About This Home
This home is located at 5350 Wyntree Ct Unit 1, Norcross, GA 30071 and is currently estimated at $562,337, approximately $235 per square foot. 5350 Wyntree Ct Unit 1 is a home located in Gwinnett County with nearby schools including Norcross Elementary School, Summerour Middle School, and Norcross High School.
Ownership History
Date
Name
Owned For
Owner Type
Purchase Details
Closed on
Nov 30, 2005
Sold by
Thomas Blake A and Thomas Mary M
Bought by
White Brian
Current Estimated Value
Home Financials for this Owner
Home Financials are based on the most recent Mortgage that was taken out on this home.
Original Mortgage
$207,920
Outstanding Balance
$114,908
Interest Rate
6.28%
Mortgage Type
New Conventional
Estimated Equity
$447,429
Purchase Details
Closed on
Apr 29, 1998
Sold by
Dill Donald C and Dill Shannon L
Bought by
Thomas Blake A and Thomas Mary M
Home Financials for this Owner
Home Financials are based on the most recent Mortgage that was taken out on this home.
Original Mortgage
$184,750
Interest Rate
7.1%
Mortgage Type
New Conventional
Purchase Details
Closed on
Sep 28, 1994
Sold by
Housing Group Partners
Bought by
Dill Donald C Shannon
Home Financials for this Owner
Home Financials are based on the most recent Mortgage that was taken out on this home.
Original Mortgage
$146,600
Interest Rate
8.53%
Create a Home Valuation Report for This Property
The Home Valuation Report is an in-depth analysis detailing your home's value as well as a comparison with similar homes in the area
Home Values in the Area
Average Home Value in this Area
Purchase History
| Date | Buyer | Sale Price | Title Company |
|---|---|---|---|
| White Brian | $259,900 | -- | |
| Thomas Blake A | $190,500 | -- | |
| Dill Donald C Shannon | $162,900 | -- |
Source: Public Records
Mortgage History
| Date | Status | Borrower | Loan Amount |
|---|---|---|---|
| Open | White Brian | $207,920 | |
| Previous Owner | Thomas Blake A | $184,750 | |
| Previous Owner | Dill Donald C Shannon | $146,600 |
Source: Public Records
Tax History Compared to Growth
Tax History
| Year | Tax Paid | Tax Assessment Tax Assessment Total Assessment is a certain percentage of the fair market value that is determined by local assessors to be the total taxable value of land and additions on the property. | Land | Improvement |
|---|---|---|---|---|
| 2025 | $5,323 | $196,880 | $38,000 | $158,880 |
| 2024 | -- | $180,560 | $39,600 | $140,960 |
| 2023 | $4,630 | $180,560 | $39,600 | $140,960 |
| 2022 | $3,921 | $158,880 | $33,680 | $125,200 |
| 2021 | $3,921 | $119,200 | $22,400 | $96,800 |
| 2020 | $3,945 | $119,200 | $22,400 | $96,800 |
| 2019 | $3,830 | $119,200 | $22,400 | $96,800 |
| 2018 | $3,628 | $109,360 | $22,400 | $86,960 |
| 2016 | $3,254 | $94,040 | $20,000 | $74,040 |
| 2015 | $3,107 | $86,920 | $16,400 | $70,520 |
| 2014 | $2,986 | $86,920 | $16,400 | $70,520 |
Source: Public Records
Map
Nearby Homes
- 3272 Monarch Pine Dr
- 3192 Monarch Pine Dr
- 3153 Corner Oak Dr
- 5196 Medlock Corners Dr
- 5534 Wynhall Dr
- 3118 Stanstead Ct
- 5211 Montine Way
- 3179 Rock Port Cir
- 5587 Trace Views Dr Unit 8
- 5589 Trace Views Dr
- 5764 Reps Trace Unit 1
- 746 Oak Terrace
- 4906 Berkeley Oak Cir
- 5355 Spalding Bridge Ct
- 4913 Berkeley Oak Cir
- 505 Cochran Dr
- 3725 Highcroft Cir
- 2897 Smith Ridge Trace
- 3680 Highcroft Cir
- 3630 Bridge Mill Ct Unit 2
- 5330 Wyntree Ct Unit 1
- 5380 Wyntree Ct
- 3315 Wyntree Dr
- 5320 Wyntree Ct Unit 1
- 5389 Monarch Pine Ln
- 5367 Wyntree Ct
- 5375 Wyntree Ct Unit 1
- 5345 Wyntree Ct Unit 1
- 5379 Monarch Pine Ln
- 5335 Wyntree Ct
- 5310 Wyntree Ct
- 5385 Wyntree Ct Unit 1
- 5325 Wyntree Ct
- 5369 Monarch Pine Ln
- 5315 Wyntree Ct
- 3320 Wyntree Dr
- 3300 Wyntree Dr Unit 1
- 3300 Wyntree Dr
- 3330 Wyntree Dr
- 5359 Monarch Pine Ln