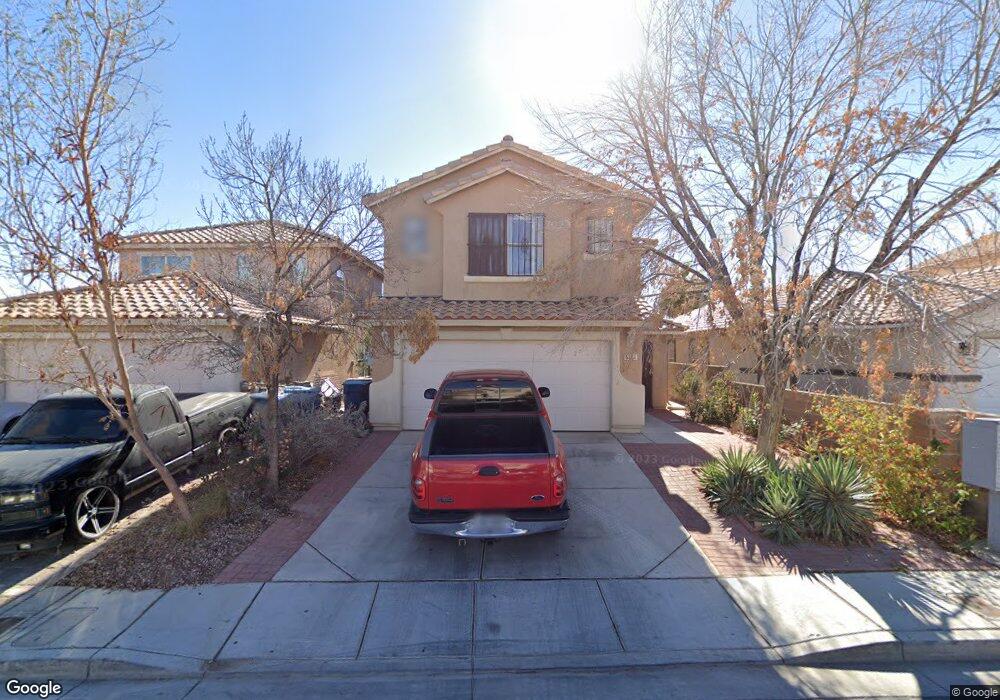
5351 Hammond Ct Las Vegas, NV 89110
Estimated Value: $393,422 - $463,000
3
Beds
3
Baths
2,077
Sq Ft
$209/Sq Ft
Est. Value
About This Home
This home is located at 5351 Hammond Ct, Las Vegas, NV 89110 and is currently estimated at $435,106, approximately $209 per square foot. 5351 Hammond Ct is a home located in Clark County with nearby schools including Charlotte & Jerry Keller Elementary School, Richard J. Rundle Elementary School, and Duane D. Keller Middle School.
Ownership History
Date
Name
Owned For
Owner Type
Purchase Details
Closed on
Feb 16, 2022
Sold by
Silvia Rodriguez-Astorga
Bought by
Rodriguez Trust
Current Estimated Value
Purchase Details
Closed on
Oct 29, 2003
Sold by
Rodriguez Astorga Silvia
Bought by
Rodriguez Astorga Silvia
Home Financials for this Owner
Home Financials are based on the most recent Mortgage that was taken out on this home.
Original Mortgage
$140,000
Interest Rate
5.98%
Mortgage Type
Unknown
Purchase Details
Closed on
Jun 30, 2001
Sold by
Olivas Jose I
Bought by
Rodriguez Astorga Silvia
Home Financials for this Owner
Home Financials are based on the most recent Mortgage that was taken out on this home.
Original Mortgage
$141,186
Interest Rate
7.15%
Mortgage Type
FHA
Purchase Details
Closed on
May 30, 2001
Sold by
Kb Home Nevada Inc
Bought by
Rodriguez Silvia and Olivas Jose I
Home Financials for this Owner
Home Financials are based on the most recent Mortgage that was taken out on this home.
Original Mortgage
$141,186
Interest Rate
7.15%
Mortgage Type
FHA
Create a Home Valuation Report for This Property
The Home Valuation Report is an in-depth analysis detailing your home's value as well as a comparison with similar homes in the area
Home Values in the Area
Average Home Value in this Area
Purchase History
| Date | Buyer | Sale Price | Title Company |
|---|---|---|---|
| Rodriguez Trust | -- | None Listed On Document | |
| Rodriguez Astorga Silvia | -- | Stewart Title Of Nevada | |
| Rodriguez Astorga Silvia | -- | -- | |
| Rodriguez Silvia | $153,681 | First American Title Co |
Source: Public Records
Mortgage History
| Date | Status | Borrower | Loan Amount |
|---|---|---|---|
| Previous Owner | Rodriguez Astorga Silvia | $140,000 | |
| Previous Owner | Rodriguez Silvia | $141,186 |
Source: Public Records
Tax History Compared to Growth
Tax History
| Year | Tax Paid | Tax Assessment Tax Assessment Total Assessment is a certain percentage of the fair market value that is determined by local assessors to be the total taxable value of land and additions on the property. | Land | Improvement |
|---|---|---|---|---|
| 2025 | $1,236 | $98,773 | $26,600 | $72,173 |
| 2024 | $1,201 | $98,773 | $26,600 | $72,173 |
| 2023 | $1,201 | $96,186 | $28,000 | $68,186 |
| 2022 | $1,222 | $83,349 | $21,000 | $62,349 |
| 2021 | $1,132 | $78,548 | $19,250 | $59,298 |
| 2020 | $1,048 | $78,086 | $19,250 | $58,836 |
| 2019 | $983 | $74,743 | $16,800 | $57,943 |
| 2018 | $938 | $67,290 | $11,970 | $55,320 |
| 2017 | $1,864 | $63,551 | $11,550 | $52,001 |
| 2016 | $879 | $55,932 | $7,700 | $48,232 |
| 2015 | $876 | $43,815 | $4,550 | $39,265 |
| 2014 | $850 | $28,128 | $4,550 | $23,578 |
Source: Public Records
Map
Nearby Homes
- 5364 Awbury Ave
- 332 Sir Jeffery Cir
- 360 Sir Richard Dr E
- 5275 Hagemann Ln
- 280 Sir Phillip St
- 179 Sir George Dr
- 5529 Cedar Ave
- 522 Wheaties Way
- 5260 Carriellen Ln
- 656 N Christy Ln
- 136 Sir George Dr
- 153 Sir Thomas Dr
- 147 N Christy Ln
- 730 N Christy Ln
- 130 Bel Port Dr Unit 133
- 0 Washington Unit 2360795
- 140 Sir David Way
- 5330 E Charleston Blvd Unit 2
- 5330 E Charleston Blvd Unit 113
- 316 Linn Ln
- 5345 Hammond Ct
- 5339 Hammond Ct
- 5350 Dawes Ct
- 5356 Dawes Ct
- 5344 Dawes Ct
- 5333 Hammond Ct
- 5338 Dawes Ct
- 5352 Hammond Ct
- 5327 Hammond Ct
- 5346 Hammond Ct
- 5332 Dawes Ct
- 5358 Hammond Ct
- 484 Boxerwood Dr
- 476 Boxerwood Dr
- 5340 Hammond Ct
- 492 Boxerwood Dr
- 468 Boxerwood Dr
- 500 Boxerwood Dr
- 5334 Hammond Ct
- 5326 Dawes Ct