Estimated Value: $215,000 - $243,000
2
Beds
2
Baths
1,480
Sq Ft
$157/Sq Ft
Est. Value
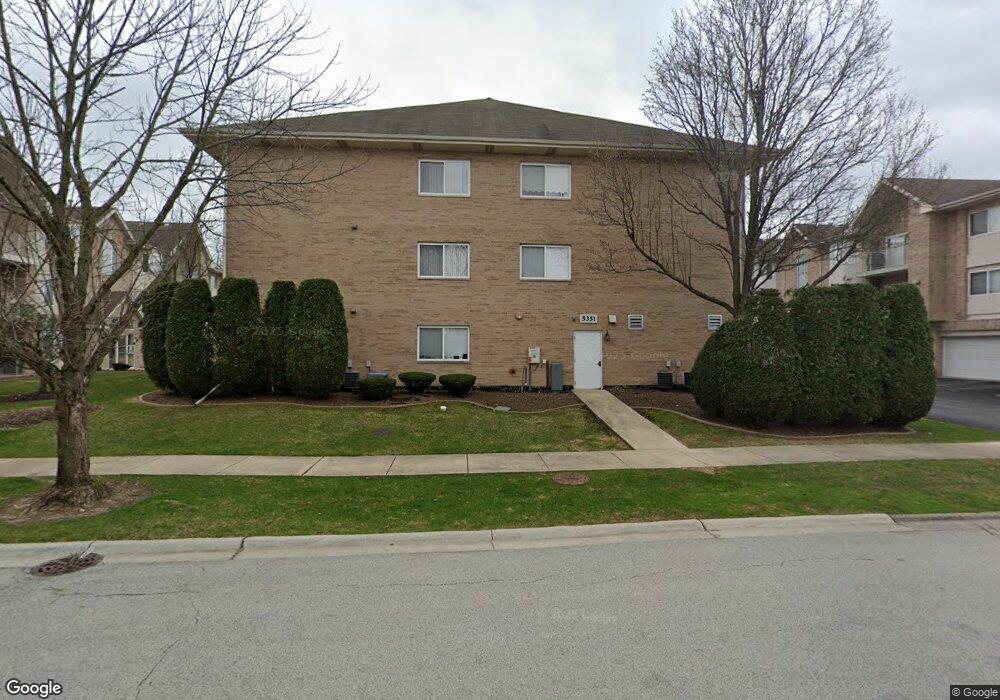
About This Home
This home is located at 5351 W Mint Julip Dr Unit 5351, Alsip, IL 60803 and is currently estimated at $232,342, approximately $156 per square foot. 5351 W Mint Julip Dr Unit 5351 is a home located in Cook County with nearby schools including Hazelgreen Elementary School, Prairie Jr High School, and Harold L. Richards High School.
Ownership History
Date
Name
Owned For
Owner Type
Purchase Details
Closed on
Jun 14, 2019
Sold by
Mcbride Catherine M
Bought by
Donnelly Patrick and Donnelly Patricia A
Current Estimated Value
Home Financials for this Owner
Home Financials are based on the most recent Mortgage that was taken out on this home.
Original Mortgage
$64,000
Outstanding Balance
$56,008
Interest Rate
3.87%
Mortgage Type
New Conventional
Estimated Equity
$176,335
Purchase Details
Closed on
Oct 23, 2013
Sold by
Hoak Karen L and Hoak David
Bought by
Mcbride Anna M and Mcbride Catherine M
Purchase Details
Closed on
Jul 14, 2005
Sold by
Klick Daniel
Bought by
Hanson Donna Marie
Purchase Details
Closed on
Aug 21, 2002
Sold by
Fifth Third Bank
Bought by
Krutzler William and Krutzler Elizabeth
Create a Home Valuation Report for This Property
The Home Valuation Report is an in-depth analysis detailing your home's value as well as a comparison with similar homes in the area
Home Values in the Area
Average Home Value in this Area
Purchase History
| Date | Buyer | Sale Price | Title Company |
|---|---|---|---|
| Donnelly Patrick | $128,000 | Heritage Title Company | |
| Mcbride Anna M | $104,000 | Fidelity National Title Insu | |
| Hanson Donna Marie | $185,000 | Chicago Title Insurance Comp | |
| Krutzler William | $177,000 | Ticor Title |
Source: Public Records
Mortgage History
| Date | Status | Borrower | Loan Amount |
|---|---|---|---|
| Open | Donnelly Patrick | $64,000 |
Source: Public Records
Tax History Compared to Growth
Tax History
| Year | Tax Paid | Tax Assessment Tax Assessment Total Assessment is a certain percentage of the fair market value that is determined by local assessors to be the total taxable value of land and additions on the property. | Land | Improvement |
|---|---|---|---|---|
| 2024 | $3,384 | $16,020 | $1,277 | $14,743 |
| 2023 | $2,720 | $16,019 | $1,276 | $14,743 |
| 2022 | $2,720 | $12,975 | $1,857 | $11,118 |
| 2021 | $2,654 | $12,973 | $1,856 | $11,117 |
| 2020 | $2,776 | $12,973 | $1,856 | $11,117 |
| 2019 | $4,319 | $11,081 | $1,682 | $9,399 |
| 2018 | $5,084 | $13,557 | $1,682 | $11,875 |
| 2017 | $5,120 | $13,557 | $1,682 | $11,875 |
| 2016 | $4,332 | $11,244 | $1,392 | $9,852 |
| 2015 | $4,296 | $11,244 | $1,392 | $9,852 |
| 2014 | $4,150 | $11,244 | $1,392 | $9,852 |
| 2013 | $3,914 | $11,947 | $1,392 | $10,555 |
Source: Public Records
Map
Nearby Homes
- 5356 W Dixie Dr Unit 5356
- 5520 W 115th St Unit 101
- 11608 S Leamington Ave
- 11242 S Avon Ave
- 11756 S Leamington Ave
- 11123 S Leamington Ave
- 5111 Deblin Ln Unit 3B
- 5120 Deblin Ln
- 11022 Deblin Ln
- 11600 S Lamon Ave
- 5303 W 109th St Unit 5303
- 11903 S Laramie Ave
- 11001 Deblin Ln Unit 203
- 11010 Central Ave Unit 3A
- 11000 Central Ave Unit 2C
- 10833 Long Ave
- 11013 Menard Ave
- 4917 W 109th St Unit 202
- 11553 S Joalyce Dr
- 10720 Laramie Ave
- 5351 W Mint Julip Dr Unit 201
- 5351 W Mint Julip Dr Unit 5351
- 5351 W Mint Julip Dr Unit 5351
- 5351 W Mint Julip Dr Unit 5351
- 5351 W Mint Julip Dr Unit 5351
- 5351 W Mint Julip Dr Unit 5351
- 5351 W Mint Julip Dr Unit 5351
- 5351 W Mint Julip Dr Unit 5351
- 5351 W Mint Julip Dr Unit 5351
- 5351 W Mint Julip Dr Unit 5351
- 5351 W Mint Julip Dr Unit 304
- 5351 W Mint Julip Dr Unit 204
- 5351 W Mint Julip Dr Unit 302
- 5351 W Mint Julip Dr Unit 301
- 5351 W Mint Julip Dr Unit 101
- 5351 W Mint Julip Dr Unit 102
- 5361 W Mint Julip Dr Unit 5361
- 5361 W Mint Julip Dr Unit 5361
- 5361 W Mint Julip Dr Unit 5361
- 5361 W Mint Julip Dr Unit 5361