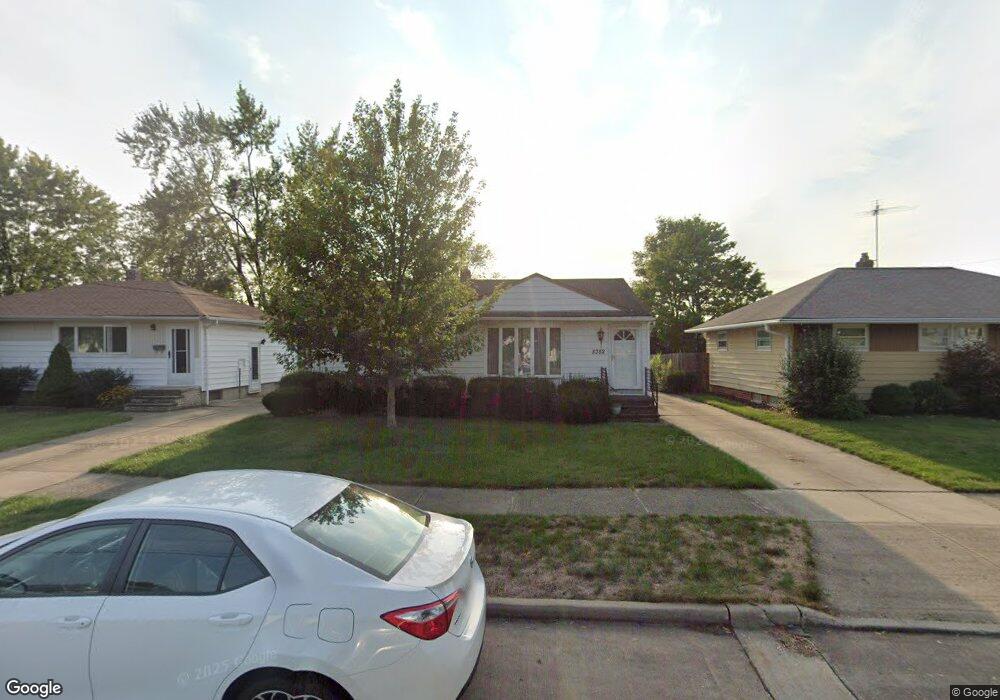
5352 W 149th St Brookpark, OH 44142
Estimated Value: $182,434 - $228,000
3
Beds
2
Baths
936
Sq Ft
$218/Sq Ft
Est. Value
About This Home
This home is located at 5352 W 149th St, Brookpark, OH 44142 and is currently estimated at $203,609, approximately $217 per square foot. 5352 W 149th St is a home located in Cuyahoga County with nearby schools including Berea-Midpark Middle School, Berea-Midpark High School, and Innovation Academy West.
Ownership History
Date
Name
Owned For
Owner Type
Purchase Details
Closed on
Dec 29, 2017
Sold by
Scharfenort Michael
Bought by
Scharfenort Kevin J
Current Estimated Value
Home Financials for this Owner
Home Financials are based on the most recent Mortgage that was taken out on this home.
Original Mortgage
$56,000
Outstanding Balance
$47,233
Interest Rate
3.92%
Mortgage Type
New Conventional
Estimated Equity
$156,376
Purchase Details
Closed on
Jun 15, 2009
Sold by
Palange Anthony J and Palange Donna M
Bought by
Scharfenort Michael
Home Financials for this Owner
Home Financials are based on the most recent Mortgage that was taken out on this home.
Original Mortgage
$88,000
Interest Rate
4.85%
Mortgage Type
Purchase Money Mortgage
Purchase Details
Closed on
Sep 18, 1989
Sold by
Sabo Edward J
Bought by
Palange Anthony J
Purchase Details
Closed on
Mar 30, 1985
Sold by
Sabo Edward J and Sabo Ann M
Bought by
Sabo Edward J
Purchase Details
Closed on
Jan 1, 1975
Bought by
Sabo Edward J and Sabo Ann M
Create a Home Valuation Report for This Property
The Home Valuation Report is an in-depth analysis detailing your home's value as well as a comparison with similar homes in the area
Home Values in the Area
Average Home Value in this Area
Purchase History
| Date | Buyer | Sale Price | Title Company |
|---|---|---|---|
| Scharfenort Kevin J | $100,000 | Third Capital Title | |
| Scharfenort Michael | $110,000 | Barristers Title Agency | |
| Palange Anthony J | $74,500 | -- | |
| Sabo Edward J | -- | -- | |
| Sabo Edward J | -- | -- |
Source: Public Records
Mortgage History
| Date | Status | Borrower | Loan Amount |
|---|---|---|---|
| Open | Scharfenort Kevin J | $56,000 | |
| Previous Owner | Scharfenort Michael | $88,000 |
Source: Public Records
Tax History
| Year | Tax Paid | Tax Assessment Tax Assessment Total Assessment is a certain percentage of the fair market value that is determined by local assessors to be the total taxable value of land and additions on the property. | Land | Improvement |
|---|---|---|---|---|
| 2024 | $2,800 | $55,510 | $9,695 | $45,815 |
| 2023 | $2,625 | $43,090 | $9,280 | $33,810 |
| 2022 | $2,606 | $43,090 | $9,280 | $33,810 |
| 2021 | $2,591 | $43,090 | $9,280 | $33,810 |
| 2020 | $2,336 | $34,200 | $7,350 | $26,850 |
| 2019 | $2,267 | $97,700 | $21,000 | $76,700 |
| 2018 | $2,127 | $34,200 | $7,350 | $26,850 |
| 2017 | $2,164 | $30,280 | $7,490 | $22,790 |
| 2016 | $2,146 | $30,280 | $7,490 | $22,790 |
| 2015 | $2,119 | $30,280 | $7,490 | $22,790 |
| 2014 | $2,119 | $31,860 | $7,880 | $23,980 |
Source: Public Records
Map
Nearby Homes
- 5727 Gateway Ln Unit 1203
- 5757 Defiance Ave
- 16379 Hummel Rd
- 15532 Rademaker Dr
- 16159 Bowfin Blvd
- 5889 Westbrook Dr
- 4713 W 150th St
- 6014 Westbrook Dr
- 16117 Hocking Blvd
- 6095 Stark Dr
- 6103 Westbrook Dr
- 4648 W 146th St
- 4638 W 156th St
- 14801 Larkfield Dr
- 14761 Larkfield Dr
- 4570 W 147th St
- 4553 W 148th St
- 13539 Bennington Ave
- 14024 Donald Dr
- 15424 Holland Rd
- 5342 W 149th St
- 5364 W 149th St
- 5332 W 149th St
- 5374 W 149th St
- 5351 W 150th St
- 5371 W 150th St
- 5322 W 149th St
- 5333 W 150th St
- 5353 W 149th St
- 5382 W 149th St
- W 149th St
- 5369 W 149th St
- 5343 W 149th St
- 5383 W 150th St
- 5333 W 149th St
- 5379 W 149th St
- 5323 W 150th St
- 5313 W 150th St
- 5389 W 149th St
- 5317 W 149th St
Your Personal Tour Guide
Ask me questions while you tour the home.