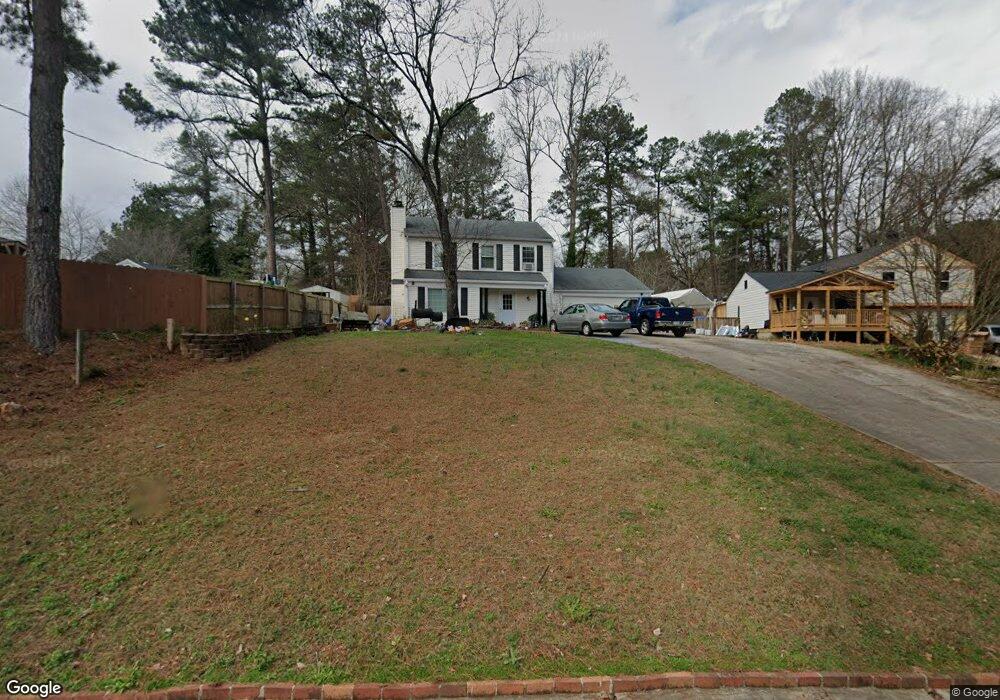
5353 Coventry Ct Unit 1 Norcross, GA 30071
Estimated Value: $318,073 - $338,000
3
Beds
2
Baths
1,396
Sq Ft
$235/Sq Ft
Est. Value
About This Home
This home is located at 5353 Coventry Ct Unit 1, Norcross, GA 30071 and is currently estimated at $327,518, approximately $234 per square foot. 5353 Coventry Ct Unit 1 is a home located in Gwinnett County with nearby schools including Norcross Elementary School, Summerour Middle School, and Norcross High School.
Ownership History
Date
Name
Owned For
Owner Type
Purchase Details
Closed on
Jun 23, 2005
Sold by
Watson Randy
Bought by
Medrano Richard and Medrano Cathy
Current Estimated Value
Home Financials for this Owner
Home Financials are based on the most recent Mortgage that was taken out on this home.
Original Mortgage
$127,900
Outstanding Balance
$65,915
Interest Rate
5.66%
Mortgage Type
New Conventional
Estimated Equity
$261,603
Purchase Details
Closed on
Mar 7, 2005
Sold by
Bank Of America
Bought by
Watson Randy
Purchase Details
Closed on
Dec 2, 2003
Sold by
Hardin Thomas R
Bought by
Bank Of America Na
Purchase Details
Closed on
May 29, 1998
Sold by
Parham Jacob E
Bought by
Hardin Thomas R
Home Financials for this Owner
Home Financials are based on the most recent Mortgage that was taken out on this home.
Original Mortgage
$83,100
Interest Rate
7.15%
Mortgage Type
New Conventional
Purchase Details
Closed on
Feb 18, 1993
Sold by
Secretary Of Hud
Bought by
Parham Jacob E
Home Financials for this Owner
Home Financials are based on the most recent Mortgage that was taken out on this home.
Original Mortgage
$77,250
Interest Rate
7.57%
Mortgage Type
FHA
Create a Home Valuation Report for This Property
The Home Valuation Report is an in-depth analysis detailing your home's value as well as a comparison with similar homes in the area
Home Values in the Area
Average Home Value in this Area
Purchase History
| Date | Buyer | Sale Price | Title Company |
|---|---|---|---|
| Medrano Richard | $127,900 | -- | |
| Watson Randy | $76,000 | -- | |
| Bank Of America Na | $96,000 | -- | |
| Hardin Thomas R | $87,500 | -- | |
| Parham Jacob E | -- | -- |
Source: Public Records
Mortgage History
| Date | Status | Borrower | Loan Amount |
|---|---|---|---|
| Open | Medrano Richard | $127,900 | |
| Previous Owner | Hardin Thomas R | $83,100 | |
| Previous Owner | Parham Jacob E | $77,250 |
Source: Public Records
Tax History Compared to Growth
Tax History
| Year | Tax Paid | Tax Assessment Tax Assessment Total Assessment is a certain percentage of the fair market value that is determined by local assessors to be the total taxable value of land and additions on the property. | Land | Improvement |
|---|---|---|---|---|
| 2025 | $3,951 | $125,040 | $25,840 | $99,200 |
| 2024 | $3,775 | $117,960 | $21,600 | $96,360 |
| 2023 | $3,775 | $117,960 | $21,600 | $96,360 |
| 2022 | $3,093 | $96,360 | $21,600 | $74,760 |
| 2021 | $2,402 | $73,240 | $14,840 | $58,400 |
| 2020 | $2,421 | $73,240 | $14,840 | $58,400 |
| 2019 | $2,969 | $69,000 | $14,000 | $55,000 |
| 2018 | $1,800 | $54,360 | $10,000 | $44,360 |
| 2016 | $1,680 | $50,800 | $10,000 | $40,800 |
| 2015 | $1,711 | $38,440 | $8,000 | $30,440 |
| 2014 | $1,297 | $38,440 | $8,000 | $30,440 |
Source: Public Records
Map
Nearby Homes
- 2199 Summertown Dr
- 5341 Goodwick Way
- 5477 Windy Creek Ln
- 5479 Windy Creek Ln
- 2375 Beaver Falls Dr
- 5364 Hickory Knoll
- 5358 Beaver Branch
- 2340 Beaver Ruin Rd Unit 26
- 2340 Beaver Ruin Rd Unit 41
- 2340 Beaver Ruin Rd
- 2340 Beaver Ruin Rd Unit 15
- 2340 Beaver Ruin Rd Unit 16
- 5357 Beaver Branch
- 5381 Station Cir Unit 3
- 5457 Rails Way
- 4242 Morrison Lake Trail
- 2325 E Hill Way NW
- 5206 Westhill Dr NW
- 2066 Pinnacle Pointe Dr
- 2472 Westhill Ct NW
- 5343 Coventry Ct
- 2227 Newbury Rd
- 2233 Newbury Rd
- 0 Coventry Ct Unit 8411473
- 5346 Lyme Bay Cir Unit 1
- 5333 Coventry Ct
- 5356 Lyme Bay Cir
- 5336 Lyme Bay Cir Unit 1
- 5354 Coventry Ct
- 5366 Lyme Bay Cir Unit 1
- 5326 Lyme Bay Cir Unit 1
- 5364 Coventry Ct Unit 1
- 5344 Coventry Ct Unit 37
- 5344 Coventry Ct Unit 1
- 5323 Coventry Ct
- 5324 Coventry Ct Unit 35
- 5324 Coventry Ct
- 5316 Lyme Bay Cir
- 5334 Coventry Ct
- 5334 Coventry Ct Unit 37