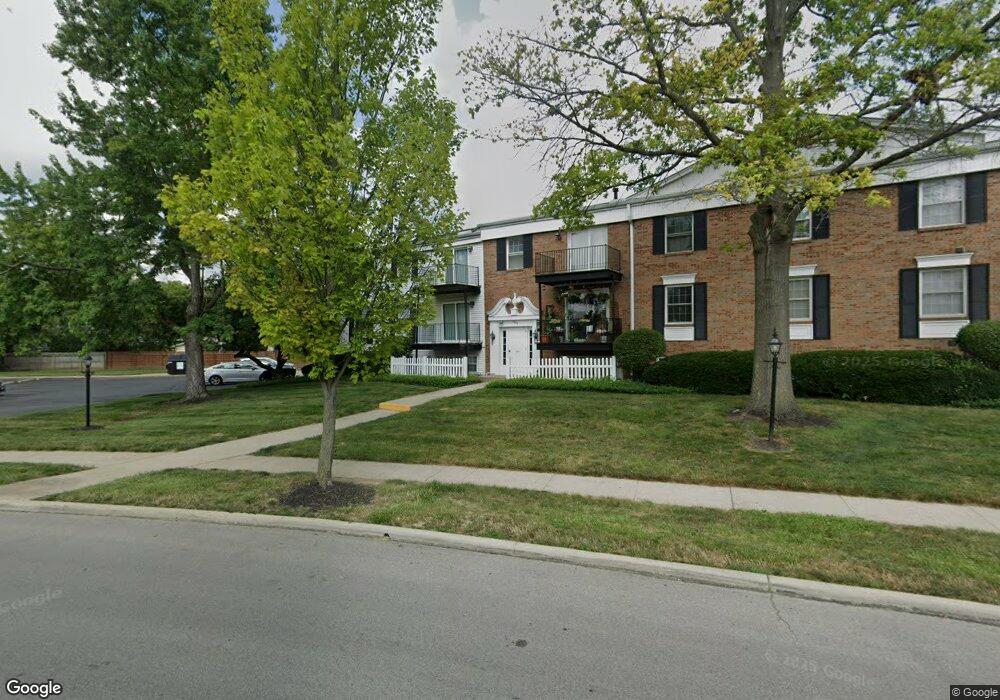
5353 Portland St Unit 303 Columbus, OH 43235
The Gables NeighborhoodEstimated Value: $131,000 - $161,000
2
Beds
2
Baths
782
Sq Ft
$186/Sq Ft
Est. Value
About This Home
This home is located at 5353 Portland St Unit 303, Columbus, OH 43235 and is currently estimated at $145,090, approximately $185 per square foot. 5353 Portland St Unit 303 is a home located in Franklin County with nearby schools including Gables Elementary School, Ridgeview Middle School, and Centennial High School.
Ownership History
Date
Name
Owned For
Owner Type
Purchase Details
Closed on
Apr 11, 2019
Sold by
Mohmmad Ali Layla T and Mohmmad Mohamad Abdulkarim
Bought by
Yilmaz Ahmet and Lee Anna
Current Estimated Value
Purchase Details
Closed on
Oct 20, 2011
Sold by
Mohammad Ali Layla T
Bought by
Mohammad Ali Layla T and Mohammad Mohamad Abdulkarim
Purchase Details
Closed on
Aug 11, 2005
Sold by
Irshaid Fawzi and Al Shadifat Alya
Bought by
Mohmmad Ali Layla T
Home Financials for this Owner
Home Financials are based on the most recent Mortgage that was taken out on this home.
Original Mortgage
$33,500
Interest Rate
5.66%
Mortgage Type
Seller Take Back
Purchase Details
Closed on
Jul 13, 1999
Sold by
Haddow Rose Marie
Bought by
Irshaid Fawzi
Purchase Details
Closed on
Jan 14, 1993
Bought by
Haddow Rose M
Purchase Details
Closed on
Jun 1, 1987
Purchase Details
Closed on
Dec 1, 1983
Create a Home Valuation Report for This Property
The Home Valuation Report is an in-depth analysis detailing your home's value as well as a comparison with similar homes in the area
Home Values in the Area
Average Home Value in this Area
Purchase History
| Date | Buyer | Sale Price | Title Company |
|---|---|---|---|
| Yilmaz Ahmet | $87,000 | Northwest Ttl Fam Of Compani | |
| Mohammad Ali Layla T | -- | Attorney | |
| Mohmmad Ali Layla T | $63,500 | -- | |
| Irshaid Fawzi | $38,500 | Celtic Title Agency Inc | |
| Haddow Rose M | $27,000 | -- | |
| -- | $36,500 | -- | |
| -- | $35,700 | -- |
Source: Public Records
Mortgage History
| Date | Status | Borrower | Loan Amount |
|---|---|---|---|
| Previous Owner | Mohmmad Ali Layla T | $33,500 |
Source: Public Records
Tax History Compared to Growth
Tax History
| Year | Tax Paid | Tax Assessment Tax Assessment Total Assessment is a certain percentage of the fair market value that is determined by local assessors to be the total taxable value of land and additions on the property. | Land | Improvement |
|---|---|---|---|---|
| 2024 | $1,936 | $42,250 | $12,250 | $30,000 |
| 2023 | $1,912 | $42,250 | $12,250 | $30,000 |
| 2022 | $2,821 | $25,870 | $3,430 | $22,440 |
| 2021 | $1,377 | $25,870 | $3,430 | $22,440 |
| 2020 | $1,346 | $25,870 | $3,430 | $22,440 |
| 2019 | $1,149 | $18,480 | $2,450 | $16,030 |
| 2018 | $1,136 | $18,480 | $2,450 | $16,030 |
| 2017 | $1,149 | $18,480 | $2,450 | $16,030 |
| 2016 | $1,234 | $18,170 | $3,570 | $14,600 |
| 2015 | $1,124 | $18,170 | $3,570 | $14,600 |
| 2014 | $1,127 | $18,170 | $3,570 | $14,600 |
| 2013 | $653 | $21,350 | $4,200 | $17,150 |
Source: Public Records
Map
Nearby Homes
- 1540 Slade Ave Unit 303
- 5363 Godown Rd
- 5111 Portland St
- 5111 Schuylkill St
- 1297 Slade Ave
- 1284 Slade Ave
- 1558 Denbigh Dr
- 1739 Paula Dr Unit 1739
- 1961 Ramble Branch Dr Unit 30
- 5485 Millington Rd
- 1164 Northport Dr
- 5268 Captains Ct
- 1466 Weybridge Rd
- 1161 Bethel Rd Unit 103/104
- 4924 Reed Rd Unit B
- 1865 Willoway Cir N Unit 1865
- 1147 Langland Dr
- 1835 Willoway Cir N
- 2179 Victoria Park Dr Unit 2179
- 2172 Hedgerow Rd Unit 2172G
- 5353 Portland St
- 5353 Portland St Unit 81
- 5353 Portland St
- 5353 Portland St Unit 302
- 5353 Portland St
- 5353 Portland St Unit 201
- 5353 Portland St Unit 203
- 5353 Portland St Unit 101
- 5353 Portland St Unit 204
- 5353 Portland St Unit 304
- 5353 Portland St Unit 76
- 5353 Portland St Unit 103
- 5353 Portland St Unit 104
- 5353 Portland St Unit 202
- 5353 Portland St Unit 102
- 5357 Portland St Unit 89
- 5357 Portland St Unit 85
- 5357 Portland St
- 5357 Portland St Unit 87
- 5357 Portland St Unit 302