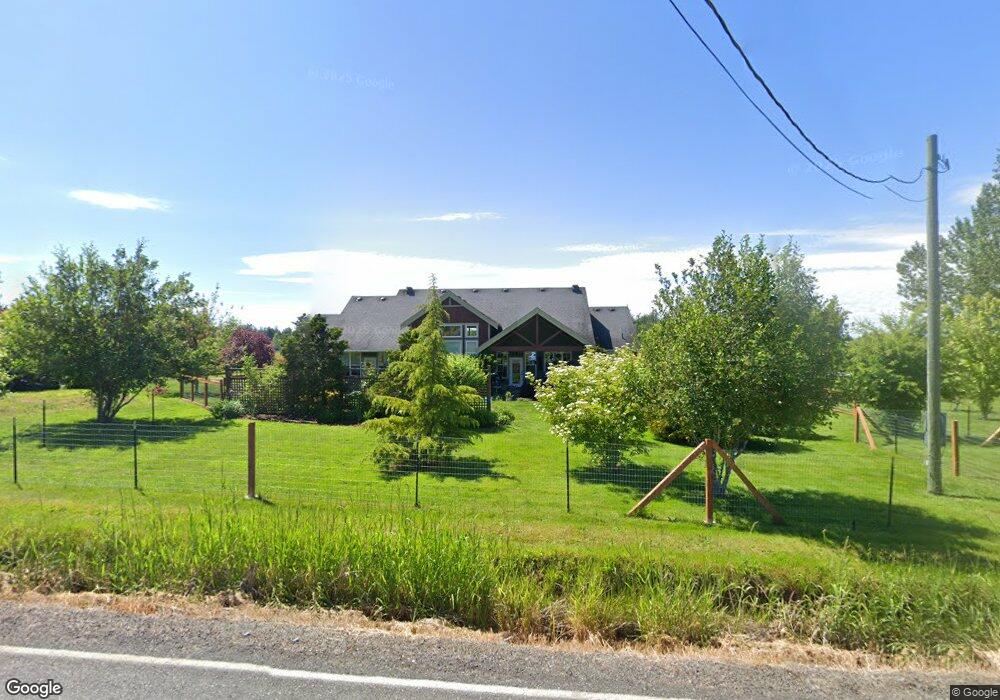
5353 Starry Rd Bellingham, WA 98226
Estimated Value: $953,000 - $1,278,000
3
Beds
3
Baths
2,755
Sq Ft
$393/Sq Ft
Est. Value
About This Home
This home is located at 5353 Starry Rd, Bellingham, WA 98226 and is currently estimated at $1,082,960, approximately $393 per square foot. 5353 Starry Rd is a home located in Whatcom County with nearby schools including Irene Reither Elementary School, Meridian Middle School, and Meridian High School.
Ownership History
Date
Name
Owned For
Owner Type
Purchase Details
Closed on
Sep 12, 2019
Sold by
Webb Nancy S and Estate Of Gary L Webb
Bought by
Webb Nancy S
Current Estimated Value
Purchase Details
Closed on
Sep 16, 2008
Sold by
Dmp Construction Inc
Bought by
Webb Gary L and Webb Nancy S
Home Financials for this Owner
Home Financials are based on the most recent Mortgage that was taken out on this home.
Original Mortgage
$465,120
Outstanding Balance
$309,221
Interest Rate
6.51%
Mortgage Type
Purchase Money Mortgage
Estimated Equity
$773,739
Purchase Details
Closed on
Oct 3, 2007
Sold by
Zander Almer D
Bought by
Dmp Construction Inc
Home Financials for this Owner
Home Financials are based on the most recent Mortgage that was taken out on this home.
Original Mortgage
$580,000
Interest Rate
6.46%
Mortgage Type
Construction
Create a Home Valuation Report for This Property
The Home Valuation Report is an in-depth analysis detailing your home's value as well as a comparison with similar homes in the area
Home Values in the Area
Average Home Value in this Area
Purchase History
| Date | Buyer | Sale Price | Title Company |
|---|---|---|---|
| Webb Nancy S | -- | None Available | |
| Webb Gary L | $581,680 | Whatcom Land Title | |
| Dmp Construction Inc | $225,280 | Whatcom Land Title |
Source: Public Records
Mortgage History
| Date | Status | Borrower | Loan Amount |
|---|---|---|---|
| Open | Webb Gary L | $465,120 | |
| Previous Owner | Dmp Construction Inc | $580,000 |
Source: Public Records
Tax History Compared to Growth
Tax History
| Year | Tax Paid | Tax Assessment Tax Assessment Total Assessment is a certain percentage of the fair market value that is determined by local assessors to be the total taxable value of land and additions on the property. | Land | Improvement |
|---|---|---|---|---|
| 2024 | $7,741 | $1,033,059 | $254,473 | $778,586 |
| 2023 | $7,741 | $997,753 | $308,929 | $688,824 |
| 2022 | $7,188 | $915,352 | $283,416 | $631,936 |
| 2021 | $6,442 | $715,111 | $221,416 | $493,695 |
| 2020 | $5,661 | $586,152 | $181,487 | $404,665 |
| 2019 | $5,087 | $516,444 | $159,904 | $356,540 |
| 2018 | $6,584 | $507,711 | $157,200 | $350,511 |
| 2017 | $5,843 | $500,107 | $181,409 | $318,698 |
| 2016 | $5,761 | $469,771 | $170,405 | $299,366 |
| 2015 | $5,780 | $461,104 | $167,261 | $293,843 |
| 2014 | -- | $448,839 | $162,812 | $286,027 |
| 2013 | -- | $433,368 | $157,200 | $276,168 |
Source: Public Records
Map
Nearby Homes
- 1321 E Smith Rd
- 5180 Penny Ln
- 5539 Noon Rd
- 1891 E Smith Rd
- 0 xxxx Kelly Rd
- 2571 E Smith Rd
- 858 E Smith Rd
- 5975 Hoag Ln
- 0 van Wyck Ln
- 5720 Denali Ln
- 5750 Denali Ln
- 4645 Vining Rd
- 2200 E Smith Rd
- 1041 Sterk Ln
- 5818 Everson Goshen Rd
- 5707 Denali Ln
- 739 Denali Ct
- 731 Denali Ct
- 740 Denali Ct
- 725 Denali Ct
- 5349 Starry Rd
- 5386 Starry Rd
- 5324 Starry Rd
- 5327 Starry Rd
- 5417 Starry Rd
- 1468 E Smith Rd
- 1535 E 54th Ln
- 1444 Howard Ln
- 1456 Howard Ln
- 5360 Muriel Dr
- 0 Starry Rd
- 1475 E Smith Rd
- 1416 E Smith Rd
- 1560 E Smith Rd
- 1555 E 54th Ln
- 5355 Muriel Dr
- 5311 Muriel Dr
- 5258 Zander Dr
- 5400 Muriel Dr
- 1580 E Smith Rd