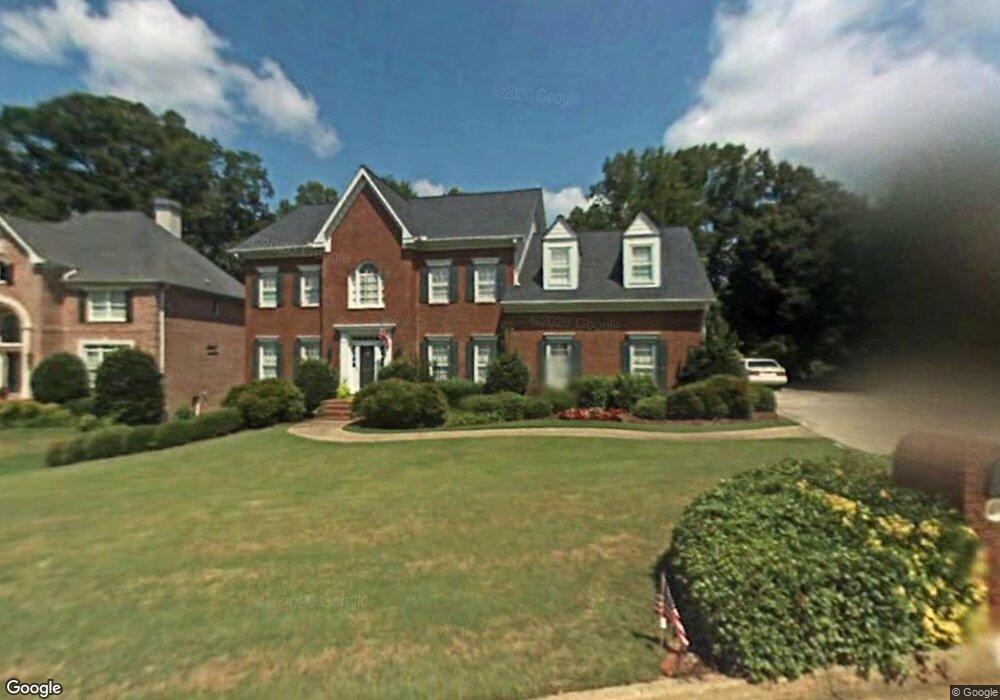
5354 Manteo Inlet Norcross, GA 30092
Estimated Value: $788,000 - $930,000
4
Beds
3
Baths
3,449
Sq Ft
$240/Sq Ft
Est. Value
About This Home
This home is located at 5354 Manteo Inlet, Norcross, GA 30092 and is currently estimated at $829,220, approximately $240 per square foot. 5354 Manteo Inlet is a home located in Gwinnett County with nearby schools including Simpson Elementary School, Pinckneyville Middle School, and Norcross High School.
Ownership History
Date
Name
Owned For
Owner Type
Purchase Details
Closed on
Aug 19, 2024
Sold by
Robinson Carter C
Bought by
Robinson Carter C and Robinson Ing Kristin
Current Estimated Value
Purchase Details
Closed on
Jun 10, 2024
Sold by
Carters Estate Trust
Bought by
Robinson Carter C and Robinson Christine
Purchase Details
Closed on
May 3, 2013
Sold by
Robinson Carter
Bought by
Robinson Carter C and Robinson Ing-Kristin B
Home Financials for this Owner
Home Financials are based on the most recent Mortgage that was taken out on this home.
Original Mortgage
$100,000
Interest Rate
3.56%
Mortgage Type
New Conventional
Purchase Details
Closed on
Feb 8, 2010
Sold by
Robinson Christine B
Bought by
Robinson Carter
Home Financials for this Owner
Home Financials are based on the most recent Mortgage that was taken out on this home.
Original Mortgage
$348,000
Interest Rate
5.01%
Mortgage Type
New Conventional
Create a Home Valuation Report for This Property
The Home Valuation Report is an in-depth analysis detailing your home's value as well as a comparison with similar homes in the area
Home Values in the Area
Average Home Value in this Area
Purchase History
| Date | Buyer | Sale Price | Title Company |
|---|---|---|---|
| Robinson Carter C | -- | -- | |
| Robinson Carter C | -- | -- | |
| Robinson Carter C | -- | -- | |
| Robinson Carter | -- | -- |
Source: Public Records
Mortgage History
| Date | Status | Borrower | Loan Amount |
|---|---|---|---|
| Previous Owner | Robinson Carter C | $100,000 | |
| Previous Owner | Robinson Carter | $348,000 |
Source: Public Records
Tax History Compared to Growth
Tax History
| Year | Tax Paid | Tax Assessment Tax Assessment Total Assessment is a certain percentage of the fair market value that is determined by local assessors to be the total taxable value of land and additions on the property. | Land | Improvement |
|---|---|---|---|---|
| 2025 | $1,768 | $291,360 | $61,560 | $229,800 |
| 2024 | $9,894 | $273,280 | $65,000 | $208,280 |
| 2023 | $9,894 | $273,280 | $65,000 | $208,280 |
| 2022 | $1,737 | $250,720 | $54,600 | $196,120 |
| 2021 | $1,732 | $205,880 | $35,520 | $170,360 |
| 2020 | $1,727 | $205,880 | $35,520 | $170,360 |
| 2019 | $1,584 | $195,800 | $30,000 | $165,800 |
| 2018 | $1,580 | $195,800 | $30,000 | $165,800 |
| 2016 | $1,531 | $172,120 | $24,000 | $148,120 |
| 2015 | $1,571 | $172,120 | $24,000 | $148,120 |
| 2014 | $1,471 | $172,120 | $24,000 | $148,120 |
Source: Public Records
Map
Nearby Homes
- 4531 Outer Bank Dr
- 5465 Fort Fisher Way
- 5465 Fort Fisher Way
- 5305 Linnadine Way
- 510 Covington Cove
- 9005 Old Southwick Pass
- 5692 Broad River View Unit 435
- 5692 Broad River View
- 5545 Fitzpatrick Terrace
- 0 Old Southwick Pass Unit 10646630
- 0 Old Southwick Pass Unit 7683754
- 5397 Valley Mist Ct
- 955 Tiverton Ln
- 5354 Fox Hill Dr
- 9295 Chandler Bluff
- 5221 W Jones Bridge Rd
- 525 Avala Ct
- 1285 Stuart Ridge
- 5040 Harrington Rd
- 4408 River Trail Dr Unit 382
- 5364 Manteo Inlet Unit 2
- 5344 Manteo Inlet
- 5374 Manteo Inlet
- 5334 Manteo Inlet
- 5345 Manteo Inlet
- 5384 Manteo Inlet
- 5405 Manteo Inlet
- 5394 Manteo Inlet
- 4651 Outer Bank Dr
- 4651 Outer Bank Dr Unit 11
- 0 Manteo Inlet Rd
- 4661 Outer Bank Dr Unit 2
- 4641 Outer Bank Dr
- 5404 Manteo Inlet
- 4665 Outer Bank Dr
- 4631 Outer Bank Dr
- 4652 Outer Bank Dr
- 4642 Outer Bank Dr Unit 2
- 5424 Manteo Inlet
- 4632 Outer Bank Dr