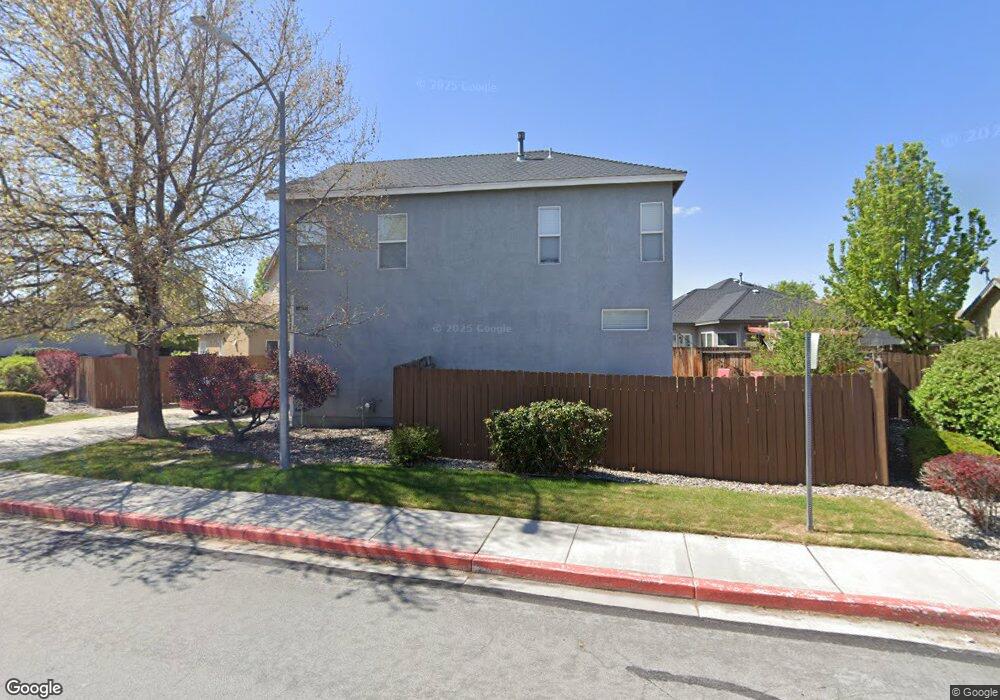
5355 Village Meadows Dr Sparks, NV 89436
Sparks Galleria NeighborhoodEstimated Value: $516,000 - $568,000
4
Beds
4
Baths
1,910
Sq Ft
$282/Sq Ft
Est. Value
About This Home
This home is located at 5355 Village Meadows Dr, Sparks, NV 89436 and is currently estimated at $538,062, approximately $281 per square foot. 5355 Village Meadows Dr is a home located in Washoe County with nearby schools including Miguel Sepulveda Elementary School, Sky Ranch Middle School, and Edward C Reed High School.
Ownership History
Date
Name
Owned For
Owner Type
Purchase Details
Closed on
Oct 16, 2017
Sold by
Lobeng Chad
Bought by
Lobegr Tatia
Current Estimated Value
Purchase Details
Closed on
Sep 7, 2010
Sold by
The Bank Of New York Mellon
Bought by
Loberg Chad L and Loberg Tatia R
Home Financials for this Owner
Home Financials are based on the most recent Mortgage that was taken out on this home.
Original Mortgage
$131,800
Interest Rate
4.31%
Mortgage Type
New Conventional
Purchase Details
Closed on
Jun 10, 2010
Sold by
Cahilig Antonio and Cahilig Jennifer
Bought by
The Bank Of New York Mellon and The Bank Of New York
Purchase Details
Closed on
Nov 19, 2007
Sold by
Cahilig Antonio and Cahilig Jennifer
Bought by
Cahilig Antonio and Cahilig Jennifer
Purchase Details
Closed on
Aug 5, 2002
Sold by
Sparks Development Llc
Bought by
Cahilig Antonio and Cahilig Jennifer
Home Financials for this Owner
Home Financials are based on the most recent Mortgage that was taken out on this home.
Original Mortgage
$167,601
Interest Rate
10.2%
Create a Home Valuation Report for This Property
The Home Valuation Report is an in-depth analysis detailing your home's value as well as a comparison with similar homes in the area
Home Values in the Area
Average Home Value in this Area
Purchase History
| Date | Buyer | Sale Price | Title Company |
|---|---|---|---|
| Lobegr Tatia | -- | None Available | |
| Loberg Chad L | $165,000 | Ticor Title Reno | |
| The Bank Of New York Mellon | $148,500 | None Available | |
| Cahilig Antonio | -- | Western Title Incorporated | |
| Cahilig Antonio | $197,178 | First American Title |
Source: Public Records
Mortgage History
| Date | Status | Borrower | Loan Amount |
|---|---|---|---|
| Previous Owner | Loberg Chad L | $131,800 | |
| Previous Owner | Cahilig Antonio | $167,601 |
Source: Public Records
Tax History Compared to Growth
Tax History
| Year | Tax Paid | Tax Assessment Tax Assessment Total Assessment is a certain percentage of the fair market value that is determined by local assessors to be the total taxable value of land and additions on the property. | Land | Improvement |
|---|---|---|---|---|
| 2025 | $2,502 | $104,686 | $29,260 | $75,426 |
| 2024 | $2,502 | $102,717 | $26,600 | $76,117 |
| 2023 | $2,430 | $99,521 | $27,405 | $72,116 |
| 2022 | $2,358 | $84,127 | $24,115 | $60,012 |
| 2021 | $2,290 | $79,263 | $19,530 | $59,733 |
| 2020 | $2,221 | $79,480 | $19,635 | $59,845 |
| 2019 | $2,156 | $76,349 | $18,655 | $57,694 |
| 2018 | $2,093 | $69,595 | $13,090 | $56,505 |
| 2017 | $2,033 | $68,938 | $12,390 | $56,548 |
| 2016 | $1,981 | $68,969 | $11,165 | $57,804 |
| 2015 | $1,978 | $67,959 | $10,115 | $57,844 |
| 2014 | $1,920 | $63,625 | $8,260 | $55,365 |
| 2013 | -- | $53,248 | $7,105 | $46,143 |
Source: Public Records
Map
Nearby Homes
- 5049 Keams Ct
- 811 Pinchot Pass Ct Unit 5
- 2084 Great Bluffs Ln Unit Homesite 5132
- 2094 Great Bluffs Ln Unit Homesite 5133
- 7129 Singing Tree Rd Unit Homesite 5121
- 801 Pinchot Pass Ct Unit 7
- 5365 Ebbetts Pass Dr
- 4950 San Diego Ct
- 601 W Equinox Peak Ct
- 601 W Equinox Peak Ct Unit Homesite 2030
- 1304 Lambrusca Dr
- 6835 Summit View Dr
- 5651 Hunting Creek Way
- 5105 Santa Anita Dr
- 1215 Ebling Dr
- 6671 April St
- 1388 Lambrays Ln
- 4956 Monrovia Dr
- 6920 Pah Rah Dr
- 6835 Pah Rah Dr
- 5355 Village Meadows Dr Unit 8
- 984 Ephedra Ln Unit 8
- 972 Ephedra Ln
- 978 Ephedra Ln
- 5385 Village Meadows Dr Unit 9
- 5362 Village Meadows Dr
- 5352 Village Meadows Dr
- 5392 Village Meadows Dr
- 5405 Village Meadows Dr
- 5334 Village Meadows Dr
- 997 Ephedra Ln
- 964 Ephedra Ln
- 5372 Village Meadows Dr
- 958 Ephedra Ln
- 979 Ephedra Ln
- 5346 Village Meadows Dr
- 5328 Village Meadows Dr
- 5382 Village Meadows Dr Unit 9
- 5400 Village Meadows Dr
- 5415 Village Meadows Dr