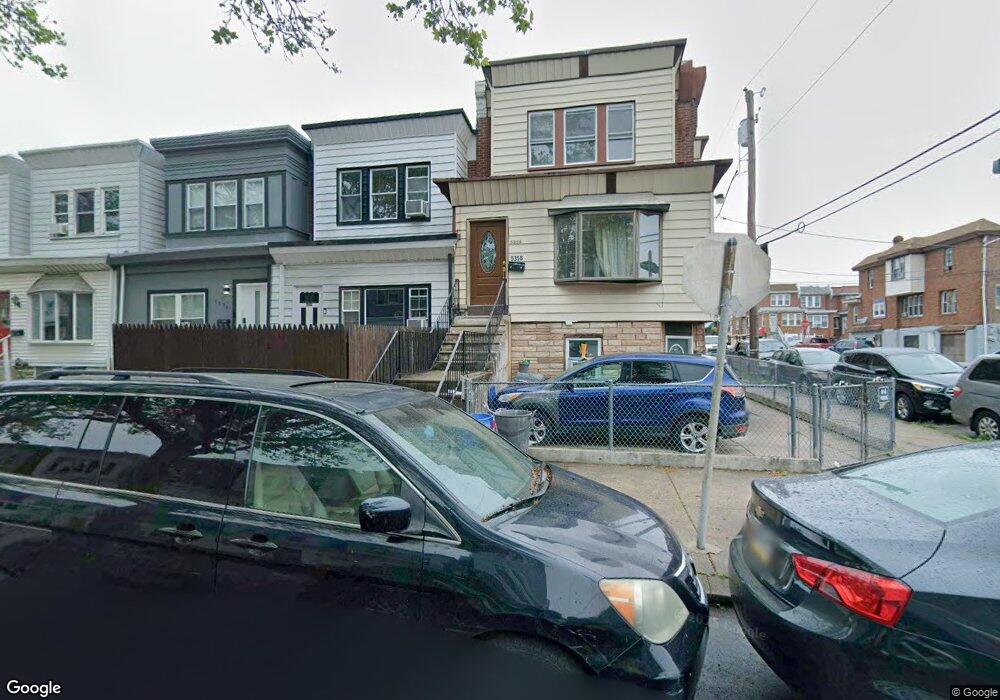
5356 Akron St Philadelphia, PA 19124
Frankford NeighborhoodEstimated Value: $188,000 - $201,000
3
Beds
1
Bath
1,080
Sq Ft
$182/Sq Ft
Est. Value
About This Home
This home is located at 5356 Akron St, Philadelphia, PA 19124 and is currently estimated at $196,755, approximately $182 per square foot. 5356 Akron St is a home located in Philadelphia County with nearby schools including Frankford High School, The Philadelphia Charter School for the Arts & Sciences, and Mastery Schools Smedley Elementary.
Ownership History
Date
Name
Owned For
Owner Type
Purchase Details
Closed on
Aug 16, 2001
Sold by
Haines Charles N
Bought by
Miller Bryant and Miller Jamella
Current Estimated Value
Home Financials for this Owner
Home Financials are based on the most recent Mortgage that was taken out on this home.
Original Mortgage
$51,460
Interest Rate
6.98%
Mortgage Type
FHA
Purchase Details
Closed on
Nov 23, 1994
Sold by
Dorgan Catherine M
Bought by
Haines Charles N
Create a Home Valuation Report for This Property
The Home Valuation Report is an in-depth analysis detailing your home's value as well as a comparison with similar homes in the area
Home Values in the Area
Average Home Value in this Area
Purchase History
| Date | Buyer | Sale Price | Title Company |
|---|---|---|---|
| Miller Bryant | $51,900 | -- | |
| Haines Charles N | $52,000 | -- |
Source: Public Records
Mortgage History
| Date | Status | Borrower | Loan Amount |
|---|---|---|---|
| Previous Owner | Miller Bryant | $51,460 |
Source: Public Records
Tax History Compared to Growth
Tax History
| Year | Tax Paid | Tax Assessment Tax Assessment Total Assessment is a certain percentage of the fair market value that is determined by local assessors to be the total taxable value of land and additions on the property. | Land | Improvement |
|---|---|---|---|---|
| 2026 | $1,816 | $162,400 | $32,480 | $129,920 |
| 2025 | $1,816 | $162,400 | $32,480 | $129,920 |
| 2024 | $1,816 | $162,400 | $32,480 | $129,920 |
| 2023 | $1,816 | $129,700 | $25,900 | $103,800 |
| 2022 | $676 | $84,700 | $25,900 | $58,800 |
| 2021 | $1,306 | $0 | $0 | $0 |
| 2020 | $1,306 | $0 | $0 | $0 |
| 2019 | $1,253 | $0 | $0 | $0 |
| 2018 | $817 | $0 | $0 | $0 |
| 2017 | $1,237 | $0 | $0 | $0 |
| 2016 | $817 | $0 | $0 | $0 |
| 2015 | $783 | $0 | $0 | $0 |
| 2014 | -- | $88,400 | $16,726 | $71,674 |
| 2012 | -- | $11,936 | $1,036 | $10,900 |
Source: Public Records
Map
Nearby Homes