5356 Sherry Ct Columbus, OH 43232
Walnut Heights NeighborhoodEstimated Value: $173,000 - $242,000
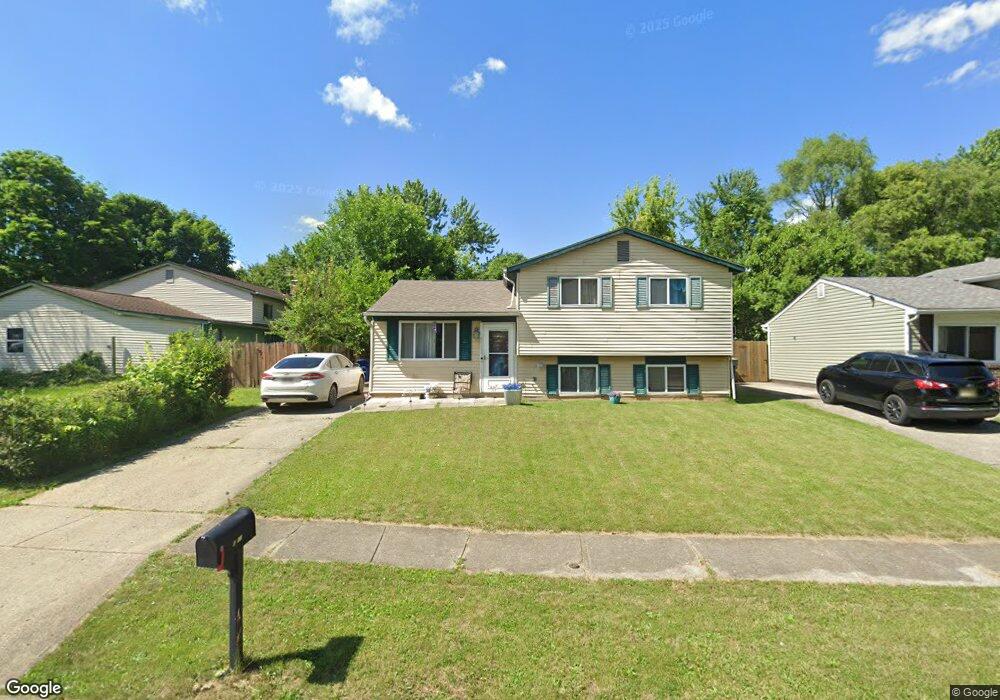
About This Home
This home is located at 5356 Sherry Ct, Columbus, OH 43232 and is currently estimated at $213,116, approximately $157 per square foot. 5356 Sherry Ct is a home located in Franklin County with nearby schools including Liberty Elementary School, Yorktown Middle School, and Independence High School.
Ownership History
We collect this data history from publicly available records. To have your information removed, we recommend requesting removal directly through your county’s website.
Purchase Details
Purchase Details
Purchase Details
Home Financials for this Owner
Home Financials are based on the most recent Mortgage that was taken out on this home.Purchase Details
Purchase Details
Purchase Details
Home Values in the Area
Average Home Value in this Area
Purchase History
We collect this data history from publicly available records. To have your information removed, we recommend requesting removal directly through your county’s website.
| Date | Buyer | Sale Price | Title Company |
|---|---|---|---|
| -- | None Listed On Document | ||
| -- | None Available | ||
| $90,000 | -- | ||
| $64,000 | Foundation Title Agency Inc | ||
| $49,500 | -- | ||
| -- | -- |
Mortgage History
We collect this data history from publicly available records. To have your information removed, we recommend requesting removal directly through your county’s website.
| Date | Status | Borrower | Loan Amount |
|---|---|---|---|
| Previous Owner | $72,000 |
Tax History
We collect this data history from publicly available records. To have your information removed, we recommend requesting removal directly through your county’s website.
| Year | Tax Paid | Tax Assessment Tax Assessment Total Assessment is a certain percentage of the fair market value that is determined by local assessors to be the total taxable value of land and additions on the property. | Land | Improvement |
|---|---|---|---|---|
| 2025 | $2,721 | $56,110 | $16,800 | $39,310 |
| 2024 | $2,721 | $56,110 | $16,800 | $39,310 |
| 2023 | $2,539 | $56,110 | $16,800 | $39,310 |
| 2022 | $1,600 | $30,110 | $5,220 | $24,890 |
| 2021 | $1,603 | $30,110 | $5,220 | $24,890 |
| 2020 | $1,605 | $30,110 | $5,220 | $24,890 |
| 2019 | $1,583 | $25,450 | $4,340 | $21,110 |
| 2018 | $1,560 | $25,450 | $4,340 | $21,110 |
| 2017 | $1,637 | $25,450 | $4,340 | $21,110 |
| 2016 | $1,691 | $24,890 | $4,410 | $20,480 |
| 2015 | $1,539 | $24,890 | $4,410 | $20,480 |
| 2014 | $1,543 | $24,890 | $4,410 | $20,480 |
| 2013 | $822 | $27,650 | $4,900 | $22,750 |
Map
- 5366 Adderley Ave
- 5423 Adderley Ave
- 2900 Gentry Ln
- 5220 Refugee Rd
- 5383 Chaumonte Ave
- 2730 Raphael Dr
- 3012 Argonne Ct
- 2695 Glenbriar St
- 2700 Raphael Dr
- 5538 Cary Ln
- 5392 Carbondale Dr
- 5290 Quincy Dr
- 5084 Refugee Rd
- 5465 Argo Ln
- 5203 Quincy Dr
- 5880 Annaberg Dr
- 2949 Fleet Rd
- 5361 Parkline Dr
- 5007 Holbrook Dr
- 5882 Abernathy Ln Unit 5882F
- 5364 Sherry Ct
- 2858 Falcon Bridge Dr
- 5370 Sherry Ct
- 5361 Refugee Rd
- 5369 Refugee Rd
- 2846 Falcon Bridge Dr
- 5378 Sherry Ct
- 5375 Refugee Rd
- 5347 Sherry Ct
- 5381 Refugee Rd
- 5353 Sherry Ct
- 2851 Falcon Bridge Dr
- 2859 Falcon Bridge Dr
- 2843 Falcon Bridge Dr
- 2865 Falcon Bridge Dr
- 5371 Sherry Ct
- 2882 Falcon Bridge Dr
- 5387 Refugee Rd
- 2871 Falcon Bridge Dr
- 5377 Sherry Ct
Ask me questions while you tour the home.