Estimated Value: $195,577 - $323,000
--
Bed
--
Bath
448
Sq Ft
$603/Sq Ft
Est. Value
About This Home
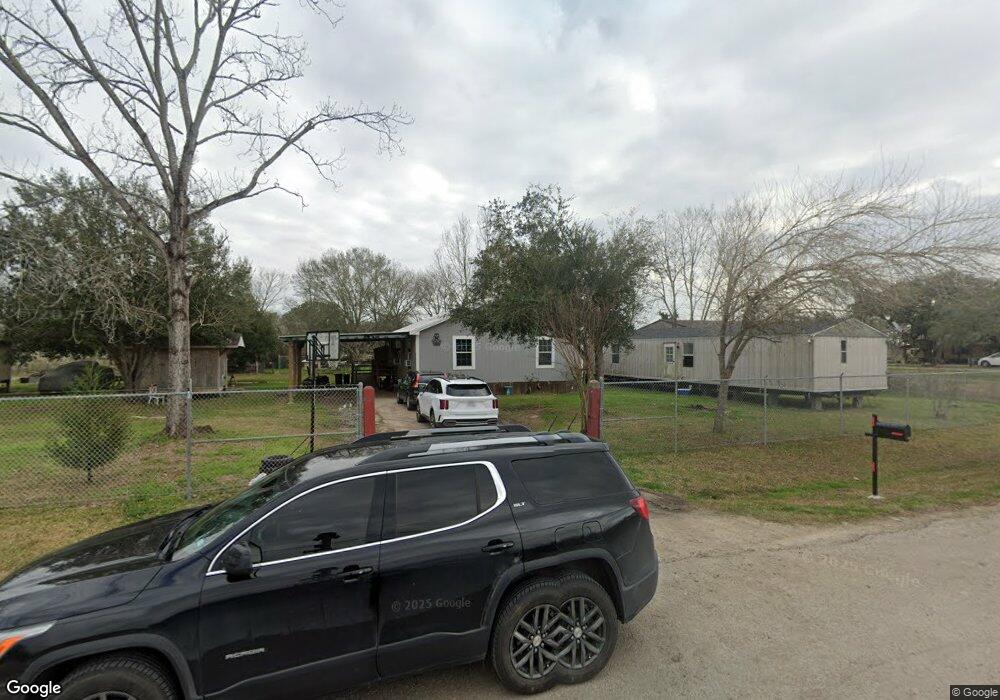
This home is located at 5358 County Road 397, Alvin, TX 77511 and is currently estimated at $270,144, approximately $603 per square foot. 5358 County Road 397 is a home with nearby schools including Hood-Case Elementary School, G.W. Harby Junior High School, and Manvel High School.
Ownership History
Date
Name
Owned For
Owner Type
Purchase Details
Closed on
Nov 24, 2015
Sold by
Rios Armando V and Rios Scholastica N
Bought by
Farasat Ali and Hashemi Seyed
Current Estimated Value
Purchase Details
Closed on
Aug 10, 2011
Sold by
J D B Services Inc
Bought by
Smith Candace L
Purchase Details
Closed on
Aug 16, 2010
Sold by
Schurr Maria Concepcion
Bought by
Aguilar Dolores V
Home Financials for this Owner
Home Financials are based on the most recent Mortgage that was taken out on this home.
Original Mortgage
$5,500
Interest Rate
4.54%
Mortgage Type
Purchase Money Mortgage
Purchase Details
Closed on
Sep 1, 2006
Sold by
Rios Adam N
Bought by
Lakeside Investment Management Inc
Purchase Details
Closed on
Dec 19, 1994
Sold by
Helton Dennis and Helton Carol
Bought by
Galvan Gilbert G
Purchase Details
Closed on
Jan 14, 1994
Sold by
Reed Mary Louise and Little Robert Ward
Bought by
J D B Services Inc
Create a Home Valuation Report for This Property
The Home Valuation Report is an in-depth analysis detailing your home's value as well as a comparison with similar homes in the area
Home Values in the Area
Average Home Value in this Area
Purchase History
| Date | Buyer | Sale Price | Title Company |
|---|---|---|---|
| Farasat Ali | -- | Stewart Title | |
| Smith Candace L | -- | None Available | |
| Aguilar Dolores V | -- | None Available | |
| Lakeside Investment Management Inc | -- | Multiple | |
| Galvan Gilbert G | -- | -- | |
| J D B Services Inc | -- | -- |
Source: Public Records
Mortgage History
| Date | Status | Borrower | Loan Amount |
|---|---|---|---|
| Previous Owner | Aguilar Dolores V | $5,500 |
Source: Public Records
Tax History Compared to Growth
Tax History
| Year | Tax Paid | Tax Assessment Tax Assessment Total Assessment is a certain percentage of the fair market value that is determined by local assessors to be the total taxable value of land and additions on the property. | Land | Improvement |
|---|---|---|---|---|
| 2025 | $2,980 | $141,320 | $112,500 | $28,820 |
| 2023 | $2,980 | $58,620 | $131,250 | $32,550 |
| 2022 | $1,135 | $53,291 | $73,500 | $27,900 |
| 2021 | $1,075 | $79,100 | $54,600 | $24,500 |
| 2020 | $990 | $73,300 | $50,400 | $22,900 |
| 2019 | $927 | $79,710 | $54,600 | $25,110 |
| 2018 | $845 | $62,700 | $42,000 | $20,700 |
| 2017 | $777 | $62,700 | $42,000 | $20,700 |
| 2016 | $707 | $50,950 | $30,000 | $20,950 |
| 2015 | $14 | $43,820 | $25,000 | $18,820 |
| 2014 | $14 | $38,970 | $25,000 | $13,970 |
Source: Public Records
Map
Nearby Homes
- 1616 County Road 393
- 138 Taxi Way Nine
- 137 Taxi Way Nine
- 142 Taxi Way Nine
- 8814 Taxi Way 3
- 141 Taxi Way Nine
- 135 Taxi Way Nine
- 9108 Quail Ridge Dr
- 19 Hal McClain
- 807 Starduster
- 1 Wolfe Ln
- 4190 County Road 145
- TBD County Rd 95 Mustang Bayou Rd
- 101 Ridge Rd
- 23105 Chablis Dr
- 0 Cr 152 Unit 10927738
- 23606 Zinfandel Dr
- 23602 Zinfandel Dr
- 21214 Creek Rd
- 23514 Zinfandel Dr
- 1471 County Road 393b
- 11B Wink Rd
- 1408 Wink Wynn Rd Unit 397
- 1497 County Road 393b
- 7 Wink Rd
- 1499 County Road 393b
- 1551 Wink Wyn Rd
- 1468 Lena Ln
- 1498 County Road 393b
- 1418 County Road 393b
- 1468 County Road 393b
- 5349 County Road 397
- 5224 County Road 397
- 1631 County Road 393a
- 5237 County Road 397
- 1685 County Road 393a
- 1699 County Road 393a
- 5194 County Road 397
- 1589 Cr 393a
- 1590 Wink Wynn Rd