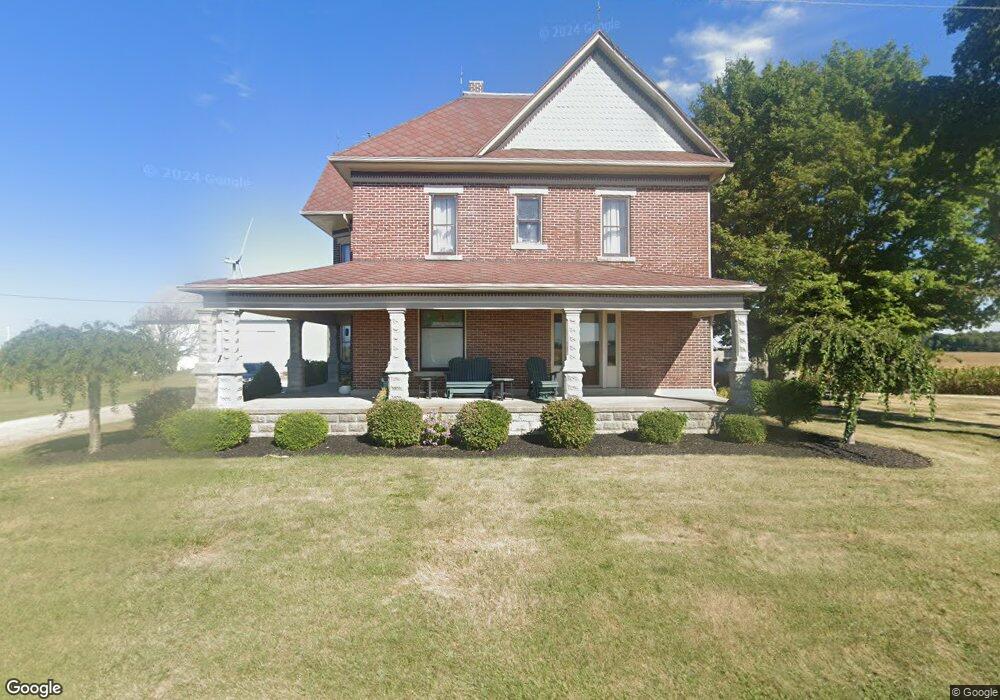
5359 S Base Rd Winchester, IN 47394
Estimated Value: $296,000 - $342,000
4
Beds
2
Baths
3,358
Sq Ft
$94/Sq Ft
Est. Value
About This Home
This home is located at 5359 S Base Rd, Winchester, IN 47394 and is currently estimated at $316,972, approximately $94 per square foot. 5359 S Base Rd is a home with nearby schools including Randolph Southern Elementary School and Randolph Southern Junior/Senior High School.
Ownership History
Date
Name
Owned For
Owner Type
Purchase Details
Closed on
Oct 14, 2016
Sold by
Wilson Zalo
Bought by
Sickels Gregory and Sickels Janette
Current Estimated Value
Home Financials for this Owner
Home Financials are based on the most recent Mortgage that was taken out on this home.
Original Mortgage
$168,000
Outstanding Balance
$111,144
Interest Rate
4.5%
Mortgage Type
Adjustable Rate Mortgage/ARM
Estimated Equity
$205,828
Purchase Details
Closed on
Jun 28, 2016
Sold by
Behagg Jerry A
Bought by
Wilson Zalo
Purchase Details
Closed on
Sep 26, 2014
Sold by
Bake James E
Bought by
Wilson Zalo and Behagg Ii Jerry A
Purchase Details
Closed on
May 28, 2013
Sold by
Karsetter Mary Sue
Bought by
Bake James E
Create a Home Valuation Report for This Property
The Home Valuation Report is an in-depth analysis detailing your home's value as well as a comparison with similar homes in the area
Home Values in the Area
Average Home Value in this Area
Purchase History
| Date | Buyer | Sale Price | Title Company |
|---|---|---|---|
| Sickels Gregory | -- | None Available | |
| Wilson Zalo | -- | None Available | |
| Wilson Zalo | -- | None Available | |
| Bake James E | -- | None Available |
Source: Public Records
Mortgage History
| Date | Status | Borrower | Loan Amount |
|---|---|---|---|
| Open | Sickels Gregory | $168,000 |
Source: Public Records
Tax History Compared to Growth
Tax History
| Year | Tax Paid | Tax Assessment Tax Assessment Total Assessment is a certain percentage of the fair market value that is determined by local assessors to be the total taxable value of land and additions on the property. | Land | Improvement |
|---|---|---|---|---|
| 2024 | $1,885 | $264,500 | $16,000 | $248,500 |
| 2023 | $2,110 | $273,000 | $16,000 | $257,000 |
| 2022 | $2,490 | $274,000 | $16,000 | $258,000 |
| 2021 | $2,259 | $242,700 | $24,000 | $218,700 |
| 2020 | $1,984 | $216,500 | $20,900 | $195,600 |
| 2019 | $1,733 | $211,300 | $20,900 | $190,400 |
| 2018 | $1,597 | $198,400 | $19,800 | $178,600 |
| 2017 | $1,503 | $199,600 | $19,800 | $179,800 |
| 2016 | $1,054 | $159,500 | $14,100 | $145,400 |
| 2014 | $918 | $154,300 | $14,200 | $140,100 |
| 2013 | $918 | $298,000 | $162,600 | $135,400 |
Source: Public Records
Map
Nearby Homes