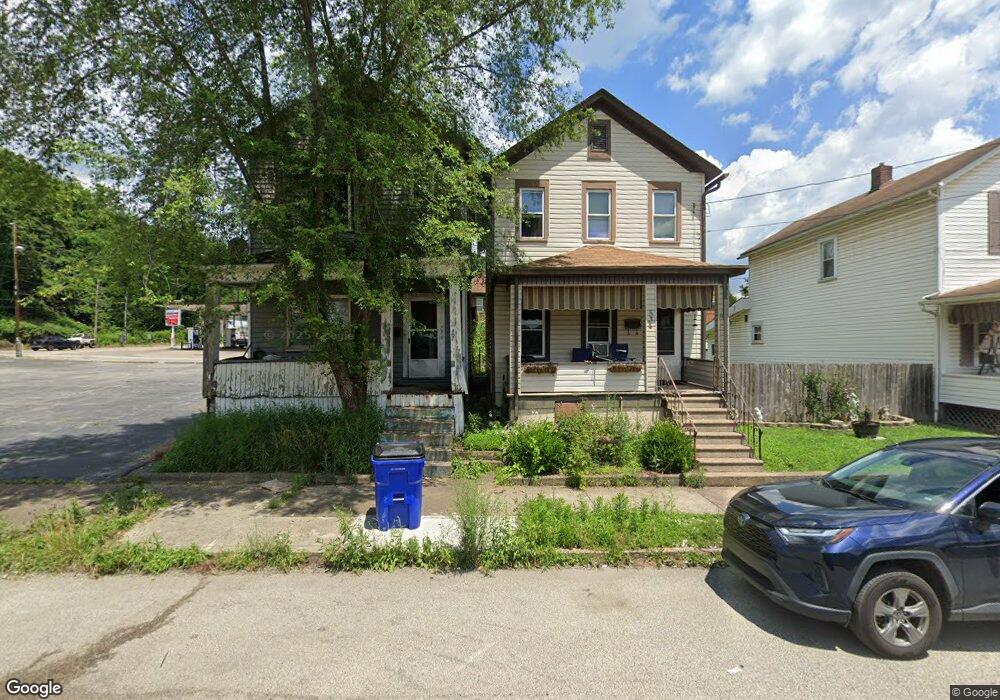
536 1st St East Liverpool, OH 43920
Estimated Value: $55,000 - $63,000
2
Beds
1
Bath
1,836
Sq Ft
$32/Sq Ft
Est. Value
About This Home
This home is located at 536 1st St, East Liverpool, OH 43920 and is currently estimated at $59,000, approximately $32 per square foot. 536 1st St is a home located in Columbiana County with nearby schools including Westgate Middle School, LaCroft Elementary School, and East Liverpool High School.
Ownership History
Date
Name
Owned For
Owner Type
Purchase Details
Closed on
Apr 24, 2024
Sold by
Sheriff Of Columbiana County
Bought by
D & E Legacy Group Llc
Current Estimated Value
Purchase Details
Closed on
Dec 13, 2018
Sold by
Legacy One Investors Grp
Bought by
Watson Investment Grp Llc
Purchase Details
Closed on
Oct 29, 2018
Sold by
Home Opportunity Llc
Bought by
Legacy 1 Investors Grp
Purchase Details
Closed on
Apr 4, 2013
Sold by
Transportation Alliance Bank Inc
Bought by
Home Opportunity Llc
Purchase Details
Closed on
Mar 30, 2012
Sold by
Home Solutions Partners Iv Reo Llc
Bought by
Transportation Alliance Bank Inc
Purchase Details
Closed on
Mar 21, 1995
Sold by
Mayers Richard
Bought by
Hughes Ralph Carter and Hughes Geraldine
Purchase Details
Closed on
Apr 22, 1991
Sold by
Carter Ralph and Carter Or
Bought by
Mayers Richard and John Ecc
Create a Home Valuation Report for This Property
The Home Valuation Report is an in-depth analysis detailing your home's value as well as a comparison with similar homes in the area
Home Values in the Area
Average Home Value in this Area
Purchase History
| Date | Buyer | Sale Price | Title Company |
|---|---|---|---|
| D & E Legacy Group Llc | $5,615 | None Listed On Document | |
| D & E Legacy Group Llc | $5,615 | None Listed On Document | |
| Watson Investment Grp Llc | -- | -- | |
| Legacy 1 Investors Grp | -- | -- | |
| Home Opportunity Llc | -- | Attorney | |
| Transportation Alliance Bank Inc | $15,416 | Attorney | |
| Hughes Ralph Carter | $15,500 | -- | |
| Mayers Richard | $15,500 | -- |
Source: Public Records
Tax History Compared to Growth
Tax History
| Year | Tax Paid | Tax Assessment Tax Assessment Total Assessment is a certain percentage of the fair market value that is determined by local assessors to be the total taxable value of land and additions on the property. | Land | Improvement |
|---|---|---|---|---|
| 2024 | $273 | $6,480 | $350 | $6,130 |
| 2023 | $369 | $6,480 | $350 | $6,130 |
| 2022 | $369 | $6,480 | $350 | $6,130 |
| 2021 | $363 | $5,850 | $320 | $5,530 |
| 2020 | $363 | $5,850 | $320 | $5,530 |
| 2019 | $301 | $5,850 | $320 | $5,530 |
| 2018 | $261 | $5,320 | $280 | $5,040 |
| 2017 | $275 | $5,320 | $280 | $5,040 |
| 2016 | $288 | $5,260 | $250 | $5,010 |
| 2015 | $264 | $5,260 | $250 | $5,010 |
| 2014 | $302 | $5,260 | $250 | $5,010 |
Source: Public Records
Map
Nearby Homes
- 534 1st St
- 1013 Saint George St
- 1045 Saint George St
- 936 Saint George St
- 1030 Saint George St
- 1147 Ohio Ave
- 1259 Erie St
- 636 River Rd
- 1615 Montrose St
- 507 Wedgewood St
- 2535 Park Way
- 920 Mckinnon Ave
- 1575 Globe St
- 915 Phoenix Ave
- 908 Phoenix Ave
- 929 Bank St
- 1001 Ambrose Ave
- 215 Alpine Way
- 1519 Saint Clair Ave
- 1507 Saint Clair Ave