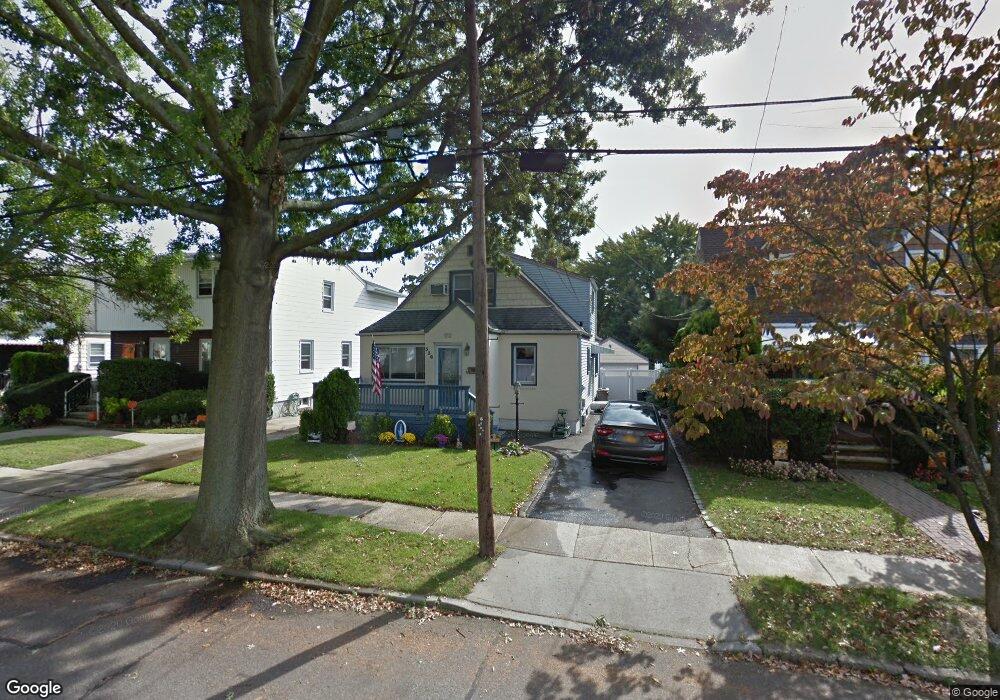
536 7th Ave New Hyde Park, NY 11040
Estimated Value: $690,865 - $842,000
--
Bed
1
Bath
1,338
Sq Ft
$593/Sq Ft
Est. Value
About This Home
This home is located at 536 7th Ave, New Hyde Park, NY 11040 and is currently estimated at $792,966, approximately $592 per square foot. 536 7th Ave is a home located in Nassau County with nearby schools including Our Lady Of Victory School and St Anne's School.
Ownership History
Date
Name
Owned For
Owner Type
Purchase Details
Closed on
Nov 23, 2016
Sold by
Farino James A and Farino Jeannine M
Bought by
Farino James A and Farino Jamie
Current Estimated Value
Purchase Details
Closed on
Jan 15, 2015
Sold by
Farino Geraldine and Farino James
Bought by
Farino James A
Purchase Details
Closed on
Feb 15, 2002
Sold by
Bullock Robert J
Bought by
Farano James
Purchase Details
Closed on
Jan 14, 1999
Sold by
Acosta Joseph and Acosta Michele
Bought by
Bullock Robert J and Bullock Kathleen
Purchase Details
Closed on
Apr 6, 1998
Purchase Details
Closed on
May 24, 1995
Sold by
Bolovis Mihail and Bolovis Argyro
Bought by
Acosta Joseph
Home Financials for this Owner
Home Financials are based on the most recent Mortgage that was taken out on this home.
Original Mortgage
$145,600
Interest Rate
7.82%
Create a Home Valuation Report for This Property
The Home Valuation Report is an in-depth analysis detailing your home's value as well as a comparison with similar homes in the area
Home Values in the Area
Average Home Value in this Area
Purchase History
| Date | Buyer | Sale Price | Title Company |
|---|---|---|---|
| Farino James A | -- | Titlevest Agency Llc | |
| Farino James A | -- | None Available | |
| Farano James | $305,000 | Deborah Sellitto | |
| Bullock Robert J | $242,000 | -- | |
| -- | -- | -- | |
| Acosta Joseph | $182,000 | -- |
Source: Public Records
Mortgage History
| Date | Status | Borrower | Loan Amount |
|---|---|---|---|
| Previous Owner | Acosta Joseph | $145,600 |
Source: Public Records
Tax History Compared to Growth
Tax History
| Year | Tax Paid | Tax Assessment Tax Assessment Total Assessment is a certain percentage of the fair market value that is determined by local assessors to be the total taxable value of land and additions on the property. | Land | Improvement |
|---|---|---|---|---|
| 2025 | $11,601 | $525 | $258 | $267 |
| 2024 | $2,562 | $525 | $258 | $267 |
| 2023 | $11,165 | $525 | $258 | $267 |
| 2022 | $11,165 | $525 | $258 | $267 |
| 2021 | $15,661 | $501 | $246 | $255 |
| 2020 | $11,166 | $786 | $686 | $100 |
| 2019 | $9,965 | $825 | $720 | $105 |
| 2017 | $6,718 | $825 | $720 | $105 |
| 2016 | $8,994 | $825 | $720 | $105 |
| 2015 | $2,184 | $825 | $720 | $105 |
| 2014 | $2,184 | $825 | $720 | $105 |
| 2013 | $2,044 | $825 | $720 | $105 |
Source: Public Records
Map
Nearby Homes