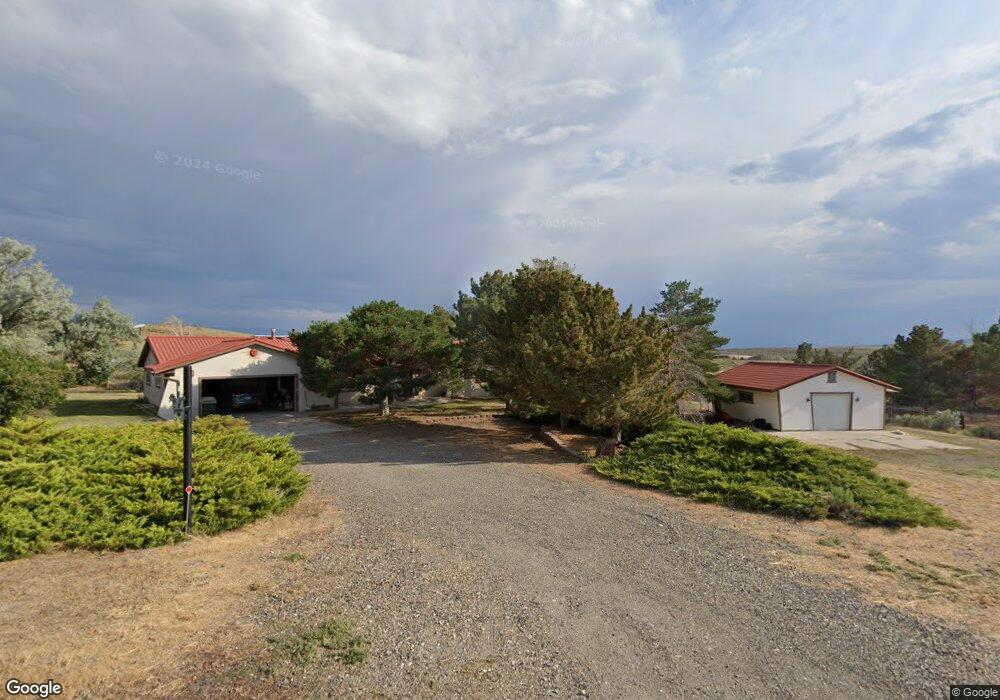
536 Belloak Dr Spring Creek, NV 89815
Estimated Value: $304,000 - $447,000
4
Beds
3
Baths
1,992
Sq Ft
$200/Sq Ft
Est. Value
About This Home
This home is located at 536 Belloak Dr, Spring Creek, NV 89815 and is currently estimated at $398,408, approximately $200 per square foot. 536 Belloak Dr is a home located in Elko County with nearby schools including Sage Elementary School, Spring Creek Middle School, and Spring Creek High School.
Ownership History
Date
Name
Owned For
Owner Type
Purchase Details
Closed on
Aug 31, 2023
Sold by
Kobielusz Justin
Bought by
Kobielusz Carla A
Current Estimated Value
Purchase Details
Closed on
Sep 26, 2017
Sold by
Arnold James A and Arnold Carrie
Bought by
Kobielusz Justin K and Kobielusz Carla A
Home Financials for this Owner
Home Financials are based on the most recent Mortgage that was taken out on this home.
Original Mortgage
$199,000
Interest Rate
3.82%
Mortgage Type
New Conventional
Purchase Details
Closed on
May 20, 2014
Sold by
Arnold Carrie
Bought by
Arnold James A and Arnold Carrie
Purchase Details
Closed on
Aug 6, 2013
Sold by
Turney William G and Turney Christine C
Bought by
Arnold James A and Arnold Carrie
Purchase Details
Closed on
Aug 24, 2007
Sold by
Turney William G and Turney Christine C
Bought by
Turney William G and Turney Christine C
Create a Home Valuation Report for This Property
The Home Valuation Report is an in-depth analysis detailing your home's value as well as a comparison with similar homes in the area
Home Values in the Area
Average Home Value in this Area
Purchase History
| Date | Buyer | Sale Price | Title Company |
|---|---|---|---|
| Kobielusz Carla A | -- | None Listed On Document | |
| Kobielusz Justin K | $299,000 | Reliant Title Elko | |
| Arnold James A | -- | None Available | |
| Arnold James A | $320,000 | Stewart Title Elko | |
| Turney William G | -- | None Available |
Source: Public Records
Mortgage History
| Date | Status | Borrower | Loan Amount |
|---|---|---|---|
| Previous Owner | Kobielusz Justin K | $199,000 |
Source: Public Records
Tax History Compared to Growth
Tax History
| Year | Tax Paid | Tax Assessment Tax Assessment Total Assessment is a certain percentage of the fair market value that is determined by local assessors to be the total taxable value of land and additions on the property. | Land | Improvement |
|---|---|---|---|---|
| 2025 | $1,482 | $59,664 | $11,550 | $48,115 |
| 2024 | $1,482 | $59,325 | $11,550 | $47,775 |
| 2023 | $1,324 | $53,278 | $9,450 | $43,828 |
| 2022 | $1,285 | $47,918 | $9,450 | $38,468 |
| 2021 | $1,377 | $48,171 | $9,450 | $38,721 |
| 2020 | $1,411 | $49,918 | $9,450 | $40,468 |
| 2019 | $1,365 | $48,335 | $9,450 | $38,885 |
| 2018 | $1,335 | $47,446 | $8,400 | $39,046 |
| 2017 | $1,227 | $47,794 | $8,400 | $39,394 |
| 2016 | $1,260 | $48,642 | $8,400 | $40,242 |
| 2015 | $1,246 | $48,839 | $8,400 | $40,439 |
| 2014 | $1,253 | $47,858 | $8,400 | $39,458 |
Source: Public Records
Map
Nearby Homes
- 934 Spring Valley Pkwy
- 434 Castlecrest Dr
- TBD Buffside Dr
- 264 Ann Way
- 511 Lynx Dr
- 0 Karval Dr
- 434 Gypsum Ln
- 882 Spring Valley Pkwy
- 524 Tiffany Dr
- 571 Holiday Dr
- 563 Brent Dr
- 574 Brent Dr
- 608 Hayland Dr
- 295 Saxon Dr
- 627 Spring Valley Pkwy
- 448 Westby Dr
- 0 Corral Ln
- 635 Spring Valley Pkwy
- 327 Merino Dr
- 302 Springfield Pkwy
- 528 Belloak Dr
- 544 Belloak Dr
- 537 Belloak Dr
- 219 Belloak Ct
- 552 Belloak Dr
- 520 Belloak Dr
- 220 Belloak Ct
- 545 Belloak Dr
- 509 Belloak Dr
- 515 Belloak Dr
- 512 Belloak Dr
- 227 Belloak Ct
- 228 Belloak Ct
- 235 Belloak Ct
- 504 Belloak Dr
- 503 Belloak Dr
- 496 Belloak Dr
- 499 Belloak Dr
- 500 Spring Valley Place
- 491 Belloak Dr