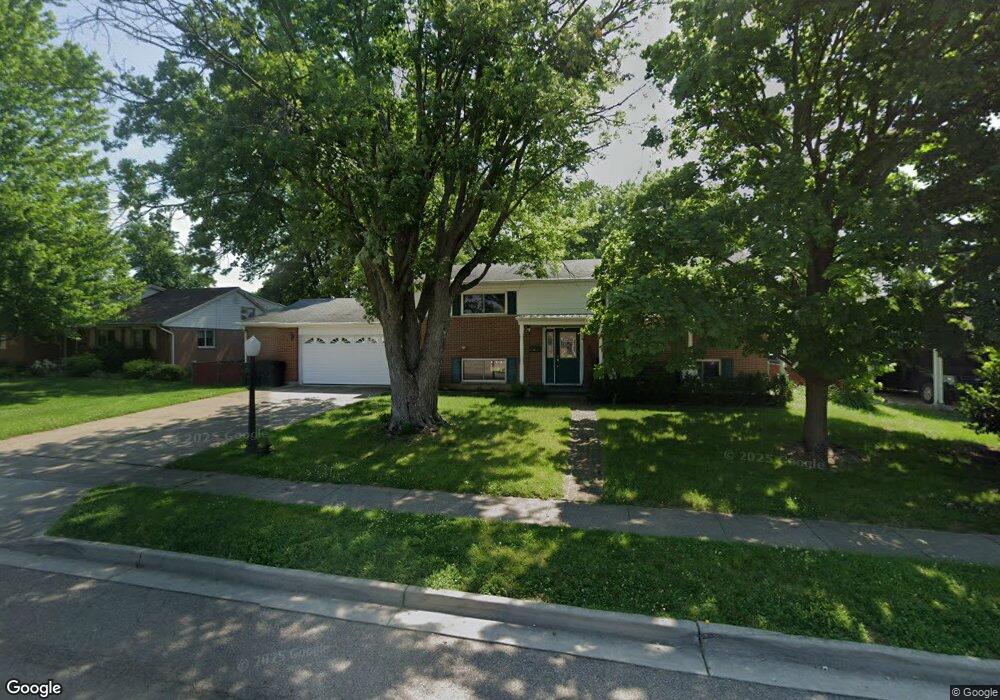
536 Bennert Dr Vandalia, OH 45377
Estimated Value: $207,810 - $290,000
3
Beds
2
Baths
1,075
Sq Ft
$220/Sq Ft
Est. Value
About This Home
This home is located at 536 Bennert Dr, Vandalia, OH 45377 and is currently estimated at $236,703, approximately $220 per square foot. 536 Bennert Dr is a home located in Montgomery County with nearby schools including Demmitt Elementary School, Smith Middle School, and Butler High School.
Ownership History
Date
Name
Owned For
Owner Type
Purchase Details
Closed on
Aug 23, 2022
Sold by
Hope Alex Boyd
Bought by
Hope Cara Arianne
Current Estimated Value
Purchase Details
Closed on
Mar 13, 2019
Sold by
Allen Victoria M and Allen Wendell Scott
Bought by
Hope Alex B and Hope Cara A
Home Financials for this Owner
Home Financials are based on the most recent Mortgage that was taken out on this home.
Original Mortgage
$184,200
Interest Rate
4.25%
Mortgage Type
Adjustable Rate Mortgage/ARM
Create a Home Valuation Report for This Property
The Home Valuation Report is an in-depth analysis detailing your home's value as well as a comparison with similar homes in the area
Home Values in the Area
Average Home Value in this Area
Purchase History
| Date | Buyer | Sale Price | Title Company |
|---|---|---|---|
| Hope Cara Arianne | -- | -- | |
| Hope Alex B | $100,000 | Home Services Title Llc |
Source: Public Records
Mortgage History
| Date | Status | Borrower | Loan Amount |
|---|---|---|---|
| Previous Owner | Hope Alex B | $184,200 |
Source: Public Records
Tax History Compared to Growth
Tax History
| Year | Tax Paid | Tax Assessment Tax Assessment Total Assessment is a certain percentage of the fair market value that is determined by local assessors to be the total taxable value of land and additions on the property. | Land | Improvement |
|---|---|---|---|---|
| 2024 | $2,779 | $51,910 | $18,080 | $33,830 |
| 2023 | $2,779 | $51,910 | $18,080 | $33,830 |
| 2022 | $2,355 | $35,550 | $12,380 | $23,170 |
| 2021 | $2,358 | $35,550 | $12,380 | $23,170 |
| 2020 | $2,351 | $35,550 | $12,380 | $23,170 |
| 2019 | $3,316 | $46,110 | $12,380 | $33,730 |
| 2018 | $2,635 | $46,110 | $12,380 | $33,730 |
| 2017 | $2,615 | $46,110 | $12,380 | $33,730 |
| 2016 | $2,475 | $43,480 | $12,380 | $31,100 |
| 2015 | $2,444 | $43,480 | $12,380 | $31,100 |
| 2014 | $2,444 | $43,480 | $12,380 | $31,100 |
| 2012 | -- | $40,620 | $12,360 | $28,260 |
Source: Public Records
Map
Nearby Homes
- 552 Tionda Dr N
- 461 Poplar Grove Dr
- 416 Attica St
- 1182 Park Forest Dr
- 246 Crest Hill Ave
- 106 Grosbeck St
- 416 Bent Twig Dr
- 314 N American Blvd
- 469 Farrell Rd
- 214 Marview Ave
- 545 Koch Ave
- 92 Waller Ave
- 775 Cassel Creek Dr
- 76 Farrell Rd
- 485 Pilot Point Unit 1-301
- 465 Pilot Point Unit 1-302
- 626 W National Rd
- 365 Inverness Ave
- 475 Pilot Point Unit 1-300
- 847 Waldsmith Way
- 602 Bennert Dr
- 528 Bennert Dr
- 613 Lancer Ave
- 520 Bennert Dr
- 605 Lancer Ave
- 535 Bennert Dr
- 601 Bennert Dr
- 527 Bennert Dr
- 621 Lancer Ave
- 322 Reichard Dr
- 609 Bennert Dr
- 519 Bennert Dr
- 620 Bennert Dr
- 314 Reichard Dr
- 330 Reichard Dr
- 629 Lancer Ave
- 617 Bennert Dr
- 403 Crestgrove Ave
- 506 Bennert Dr
- 511 Bennert Dr