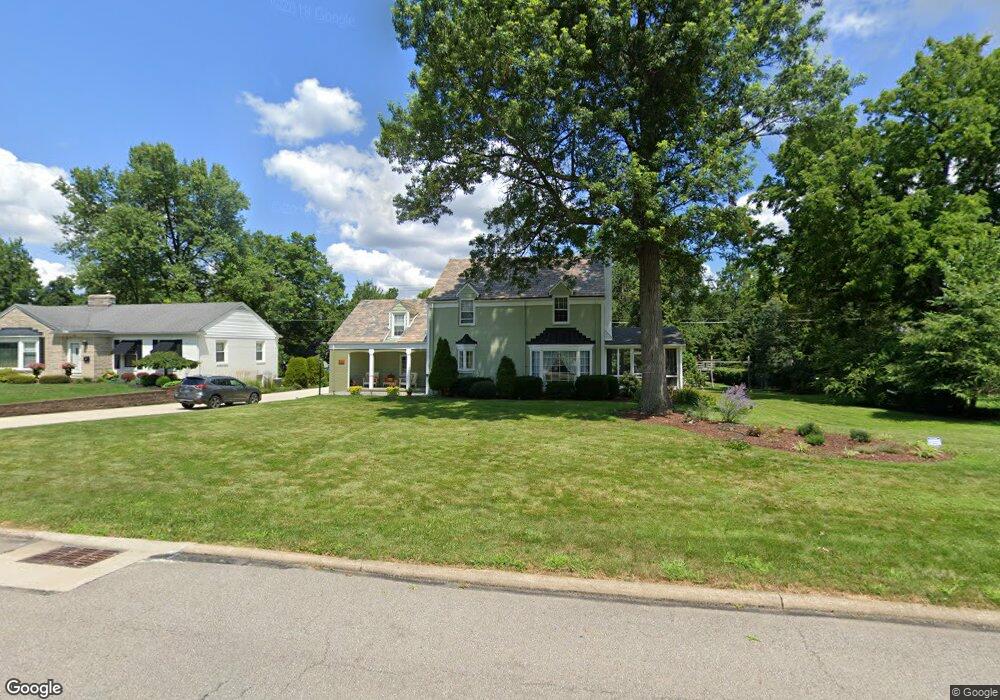
536 Chevy Chase Rd Mansfield, OH 44907
Estimated Value: $270,000 - $333,000
4
Beds
4
Baths
2,742
Sq Ft
$107/Sq Ft
Est. Value
About This Home
This home is located at 536 Chevy Chase Rd, Mansfield, OH 44907 and is currently estimated at $292,938, approximately $106 per square foot. 536 Chevy Chase Rd is a home located in Richland County with nearby schools including Discovery School, St. Peter's Elementary/Montessori School, and Mansfield Seventh-day Adventist School.
Ownership History
Date
Name
Owned For
Owner Type
Purchase Details
Closed on
Jan 17, 2025
Sold by
Allred Jay J and Lawson-Allred Amy
Bought by
Allred Family Trust and Allred
Current Estimated Value
Purchase Details
Closed on
Jul 20, 2015
Sold by
Widrick James and Widrick Marty
Bought by
Allred Jay J and Lawson Allred Amy
Home Financials for this Owner
Home Financials are based on the most recent Mortgage that was taken out on this home.
Original Mortgage
$131,500
Interest Rate
4.25%
Mortgage Type
Adjustable Rate Mortgage/ARM
Purchase Details
Closed on
Jun 30, 1995
Sold by
Bank One Mansfield
Bought by
Russell Mark C and Russell Lori J Stanton
Home Financials for this Owner
Home Financials are based on the most recent Mortgage that was taken out on this home.
Original Mortgage
$114,750
Interest Rate
5.25%
Mortgage Type
New Conventional
Purchase Details
Closed on
Feb 24, 1995
Sold by
Shrf Sharon G Savoy Pr
Bought by
Bank One Mansfield
Create a Home Valuation Report for This Property
The Home Valuation Report is an in-depth analysis detailing your home's value as well as a comparison with similar homes in the area
Home Values in the Area
Average Home Value in this Area
Purchase History
| Date | Buyer | Sale Price | Title Company |
|---|---|---|---|
| Allred Family Trust | $250 | None Listed On Document | |
| Allred Jay J | $147,000 | Attorney | |
| Russell Mark C | $135,000 | -- | |
| Bank One Mansfield | $116,000 | -- |
Source: Public Records
Mortgage History
| Date | Status | Borrower | Loan Amount |
|---|---|---|---|
| Previous Owner | Allred Jay J | $131,500 | |
| Previous Owner | Russell Mark C | $114,750 |
Source: Public Records
Tax History
| Year | Tax Paid | Tax Assessment Tax Assessment Total Assessment is a certain percentage of the fair market value that is determined by local assessors to be the total taxable value of land and additions on the property. | Land | Improvement |
|---|---|---|---|---|
| 2024 | $3,595 | $78,420 | $8,230 | $70,190 |
| 2023 | $3,675 | $78,420 | $8,230 | $70,190 |
| 2022 | $3,277 | $58,600 | $7,360 | $51,240 |
| 2021 | $3,300 | $58,600 | $7,360 | $51,240 |
| 2020 | $3,375 | $58,600 | $7,360 | $51,240 |
| 2019 | $3,195 | $50,050 | $6,240 | $43,810 |
| 2018 | $3,151 | $50,050 | $6,240 | $43,810 |
| 2017 | $2,999 | $50,050 | $6,240 | $43,810 |
| 2016 | $2,931 | $46,390 | $6,240 | $40,150 |
| 2015 | $2,931 | $46,390 | $6,240 | $40,150 |
| 2014 | $2,763 | $46,390 | $6,240 | $40,150 |
| 2012 | $2,106 | $46,390 | $6,240 | $40,150 |
Source: Public Records
Map
Nearby Homes
- 889 Andover Rd
- 710 Lexington Ave
- 810 Lexington Ave
- 655 Woodhill Rd
- 644 Andover Rd
- 791 Woodland Rd
- 0 George Ave
- 400 James Ave
- 575 Crescent Rd
- 535 Woodhill Rd
- 986 Woodland Rd
- 470 Lexington Ave
- 466 Lexington Ave
- 489 Clifton Blvd
- 530 Wood St
- 310 Townview Cir N
- 616 Cline Ave
- 507 Townview Cir E
- 735 Courtwright Blvd
- 0 Bally Row Unit Lot 22930 223011207
- 550 Chevy Chase Rd
- 541 Edgewood Rd
- 556 Chevy Chase Rd
- 520 Chevy Chase Rd
- 551 Edgewood Rd
- 541 Chevy Chase Rd
- 525 Chevy Chase Rd
- 563 Edgewood Rd
- 560 Chevy Chase Rd
- 549 Chevy Chase Rd
- 521 Chevy Chase Rd
- 519 Edgewood Rd
- 571 Edgewood Rd
- 559 Chevy Chase Rd
- 515 Chevy Chase Rd
- 511 Edgewood Rd
- 500 Chevy Chase Rd
- 550 Edgewood Rd
- 550 Edgewood Rd
- 763 Dickson Pkwy
Your Personal Tour Guide
Ask me questions while you tour the home.