536 Chubbtown Rd Cedartown, GA 30125
Estimated Value: $533,000 - $1,579,000
4
Beds
4
Baths
3,045
Sq Ft
$368/Sq Ft
Est. Value
About This Home
This home is located at 536 Chubbtown Rd, Cedartown, GA 30125 and is currently estimated at $1,119,112, approximately $367 per square foot. 536 Chubbtown Rd is a home located in Polk County.
Ownership History
Date
Name
Owned For
Owner Type
Purchase Details
Closed on
Aug 18, 2017
Sold by
Osborne Sandy S
Bought by
Morris John Randall and Morris Kelly D
Current Estimated Value
Home Financials for this Owner
Home Financials are based on the most recent Mortgage that was taken out on this home.
Original Mortgage
$596,800
Interest Rate
3.96%
Mortgage Type
New Conventional
Purchase Details
Closed on
Nov 17, 2016
Sold by
Brenda
Bought by
Osborne Sandy S
Purchase Details
Closed on
Jan 23, 1996
Sold by
Kawasaki Of Birmingham Inc
Bought by
Budlong Brenda and Osborne Sandy S
Purchase Details
Closed on
Dec 14, 1994
Sold by
Hickam Nancy Murray and Richard Michael
Bought by
Kawasaki Of Bermingham Inc
Purchase Details
Closed on
Nov 18, 1993
Sold by
Murphy John
Bought by
Hickam Nancy M and Richard Michael
Purchase Details
Closed on
Jan 17, 1992
Sold by
Murray John
Bought by
Murray Richard and Murray Pat
Purchase Details
Closed on
Aug 14, 1986
Bought by
Murray John
Purchase Details
Closed on
Aug 4, 1986
Sold by
Green Samuel L Admin
Bought by
Murray John
Purchase Details
Closed on
Feb 6, 1986
Bought by
Green Samuel L Admin
Create a Home Valuation Report for This Property
The Home Valuation Report is an in-depth analysis detailing your home's value as well as a comparison with similar homes in the area
Home Values in the Area
Average Home Value in this Area
Purchase History
| Date | Buyer | Sale Price | Title Company |
|---|---|---|---|
| Morris John Randall | $746,500 | -- | |
| Osborne Sandy S | -- | -- | |
| Budlong Brenda | -- | -- | |
| Budlong Brenda Osborne Sandy S | $125,000 | -- | |
| Kawasaki Of Bermingham Inc | $85,000 | -- | |
| Hickam Nancy M | -- | -- | |
| Murray Richard | $16,000 | -- | |
| Murray John | -- | -- | |
| Murray John | -- | -- | |
| Green Samuel L Admin | -- | -- |
Source: Public Records
Mortgage History
| Date | Status | Borrower | Loan Amount |
|---|---|---|---|
| Closed | Morris John Randall | $596,800 |
Source: Public Records
Tax History Compared to Growth
Tax History
| Year | Tax Paid | Tax Assessment Tax Assessment Total Assessment is a certain percentage of the fair market value that is determined by local assessors to be the total taxable value of land and additions on the property. | Land | Improvement |
|---|---|---|---|---|
| 2024 | $8,504 | $406,812 | $143,920 | $262,892 |
| 2023 | $7,869 | $331,589 | $143,920 | $187,669 |
| 2022 | $6,980 | $294,138 | $125,282 | $168,856 |
| 2021 | $7,071 | $294,138 | $125,282 | $168,856 |
| 2020 | $7,085 | $294,138 | $125,282 | $168,856 |
| 2019 | $8,281 | $308,360 | $125,282 | $183,078 |
| 2018 | $8,228 | $304,872 | $125,282 | $179,590 |
| 2017 | $8,248 | $305,105 | $125,515 | $179,590 |
| 2016 | $9,994 | $369,246 | $195,281 | $173,965 |
| 2015 | $8,595 | $316,891 | $195,281 | $121,610 |
| 2014 | $8,658 | $316,891 | $195,281 | $121,610 |
Source: Public Records
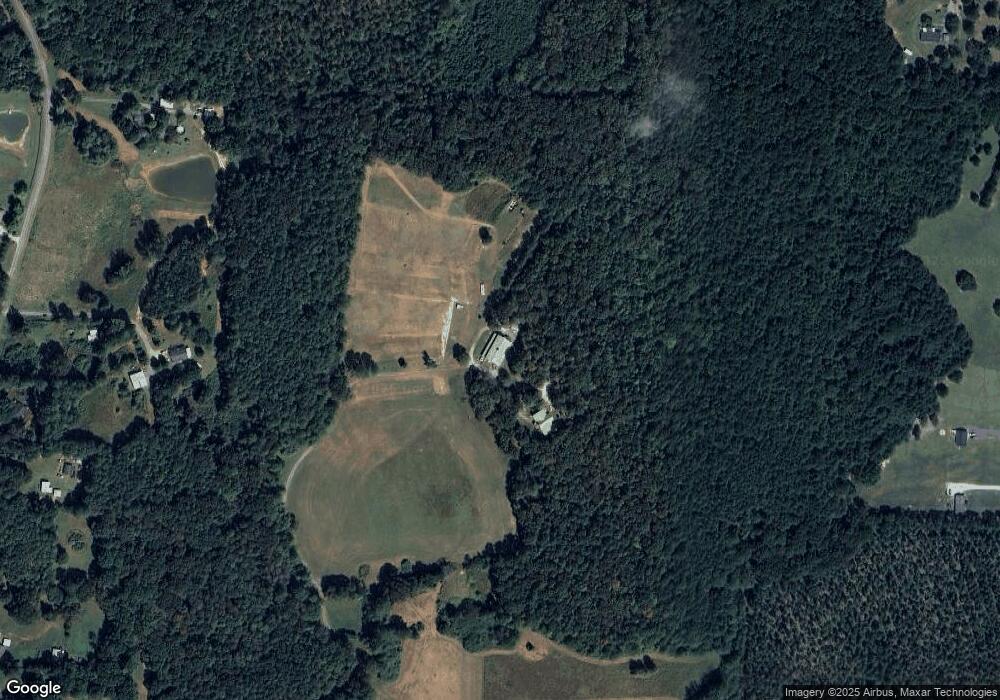
Map
Nearby Homes
- 100 Lee Ave
- 383 Valley Grove Rd
- 424 Michael Blvd
- 600 Miller Rd
- 0 Cave Spring Rd Unit 10631588
- 0 Cave Spring Rd Unit 7671027
- 374 Seab Green Rd
- 1200 N Cave Spring St
- 727 Cherokee Rd
- 88 Sequoyah Ct
- 217 Cherokee Cir
- 828 N College Dr
- 113 Cherokee Estates Dr
- LOT 21 Cherokee Cir
- 208 Silverthorn Way
- 39 Summerwind Dr
- 621 N College Dr
- 00 Oak Crest Dr
- 232 Stephens Rd
- 0 Collins Rd Unit 10627302
- 425 Chubbtown Rd Unit 792
- 425 Chubbtown Rd
- 425 Chubb Town Rd
- 425 Chubb Town Rd
- 425 Chubb Town Rd Unit 792
- 434 Chubb Town Rd
- 12 Michael Blvd
- 404 Chubb Town Rd
- 9 Michael Blvd
- 449 Chubb Town Rd
- 13 Michael Blvd
- 509 Chubbtown Rd
- 527 Valley Grove Rd
- 0 Valley Grove Rd Unit 8426849
- 0 Valley Grove Rd Unit 6050648
- 0 Valley Grove Rd Unit 7126910
- 0 Valley Grove Rd Unit 5-7 7451864
- 0 Valley Grove Rd
- 0 Valley Grove Rd Unit 7014431
- 0 Valley Grove Rd Unit 20023831