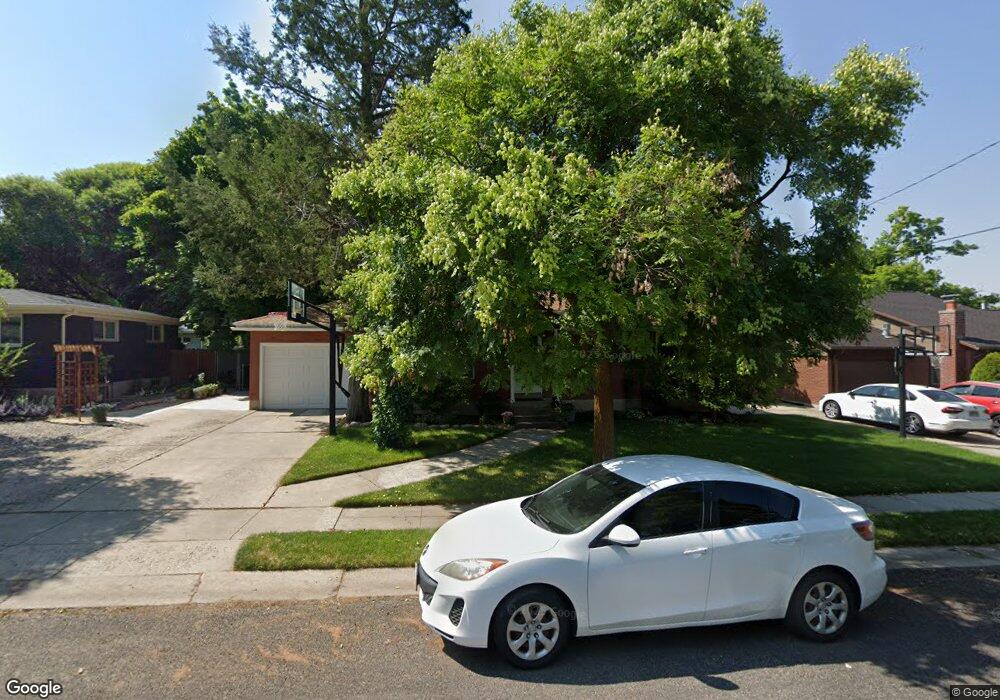
536 E 1100 N Logan, UT 84341
Adams NeighborhoodEstimated Value: $383,000 - $431,000
About This Home
This home is located at 536 E 1100 N, Logan, UT 84341 and is currently estimated at $405,411, approximately $197 per square foot. 536 E 1100 N is a home located in Cache County with nearby schools including Adams Elementary School, Mount Logan Middle School, and Logan High School.
Ownership History
We collect this data history from publicly available records. To have your information removed, we recommend requesting removal directly through your county’s website.
Purchase Details
Purchase Details
Home Financials for this Owner
Home Financials are based on the most recent Mortgage that was taken out on this home.Purchase Details
Home Financials for this Owner
Home Financials are based on the most recent Mortgage that was taken out on this home.Home Values in the Area
Average Home Value in this Area
Purchase History
We collect this data history from publicly available records. To have your information removed, we recommend requesting removal directly through your county’s website.
| Date | Buyer | Sale Price | Title Company |
|---|---|---|---|
| -- | Accommodation | ||
| -- | American Secure Title | ||
| -- | -- |
Mortgage History
We collect this data history from publicly available records. To have your information removed, we recommend requesting removal directly through your county’s website.
| Date | Status | Borrower | Loan Amount |
|---|---|---|---|
| Previous Owner | $110,171 |
Tax History
We collect this data history from publicly available records. To have your information removed, we recommend requesting removal directly through your county’s website.
| Year | Tax Paid | Tax Assessment Tax Assessment Total Assessment is a certain percentage of the fair market value that is determined by local assessors to be the total taxable value of land and additions on the property. | Land | Improvement |
|---|---|---|---|---|
| 2025 | $1,774 | $229,470 | $0 | $0 |
| 2024 | $1,832 | $229,470 | $0 | $0 |
| 2023 | $1,912 | $228,260 | $0 | $0 |
| 2022 | $1,751 | $195,255 | $0 | $0 |
| 2021 | $1,602 | $275,940 | $50,000 | $225,940 |
| 2020 | $1,444 | $223,800 | $50,000 | $173,800 |
| 2019 | $1,509 | $223,800 | $50,000 | $173,800 |
| 2018 | $1,223 | $165,584 | $50,000 | $115,584 |
| 2017 | $1,115 | $79,860 | $0 | $0 |
| 2016 | $1,156 | $79,860 | $0 | $0 |
| 2015 | $1,158 | $79,860 | $0 | $0 |
| 2014 | $1,046 | $79,860 | $0 | $0 |
| 2013 | -- | $78,745 | $0 | $0 |
Map
- 1026 N 500 E
- 495 E 1000 N
- 1188 N 600 E
- 415 E 1150 N
- 681 E 1200 N
- 390 E 1200 N
- 359 E 1075 N
- 1154 Wasatch Dr
- 633 E 1260 N
- 871 N 700 E
- 287 E 1000 N
- 322 E 900 N
- 1269 N 400 E Unit 3
- 757 N 500 E
- 744 N 500 E
- 235 E 1100 N
- 1246 E Talmage Ln Unit 32
- 1261 E Talmage Ln Unit 59
- 1241 E Talmage Ln Unit 31
- 560 E 700 N
- 546 E 1100 N
- 531 Douglas Dr
- 543 Douglas Dr
- 519 Douglas Dr
- 1066 N 500 E
- 525 E 1100 N
- 547 E 1100 N
- 557 Douglas Dr
- 1050 N 500 E
- 555 E 1100 N
- 515 E 1100 N
- 568 E 1100 N
- 735 N 500 E Unit 3
- 1104 N 500 E Unit 1104 N 500 E Logan
- 575 Douglas Dr
- 532 Douglas Dr
- 567 E 1100 N
- 554 E 1150 N
- 544 E 1150 N
- 520 Douglas Dr
Ask me questions while you tour the home.