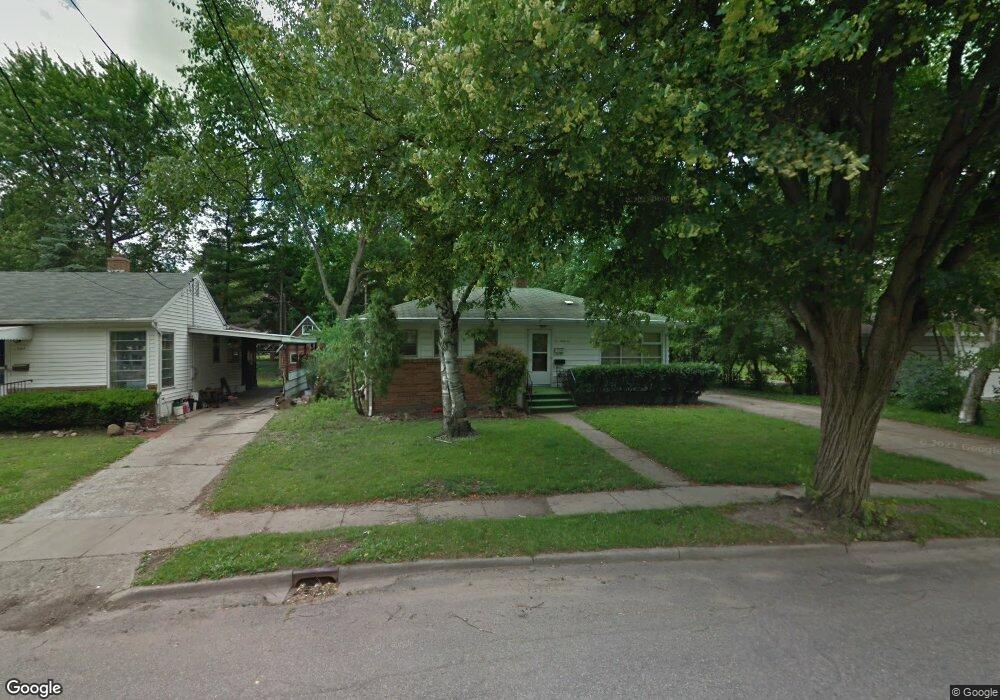
536 E Willard Ave Lansing, MI 48910
Old Everett NeighborhoodEstimated Value: $158,000 - $170,768
2
Beds
1
Bath
1,000
Sq Ft
$163/Sq Ft
Est. Value
About This Home
This home is located at 536 E Willard Ave, Lansing, MI 48910 and is currently estimated at $163,442, approximately $163 per square foot. 536 E Willard Ave is a home located in Ingham County with nearby schools including Lyons Elementary School, Attwood School, and Everett High School.
Ownership History
Date
Name
Owned For
Owner Type
Purchase Details
Closed on
Jun 4, 2018
Sold by
Camelback Ix Llc
Bought by
Second Chance Property Investments Llc
Current Estimated Value
Purchase Details
Closed on
Sep 5, 2014
Sold by
Camelback Ix Llc
Bought by
Wr Asset Trust
Purchase Details
Closed on
Jul 14, 2014
Sold by
Azcan Rpg Llc
Bought by
Camelback Ix Llc
Purchase Details
Closed on
Jan 23, 2013
Sold by
Mi Seven Llc
Bought by
Azcan Rpg Llc
Purchase Details
Closed on
Sep 23, 2010
Sold by
Hathaway Michelle
Bought by
Nationstar Mortgage Llc
Purchase Details
Closed on
Sep 9, 2010
Sold by
Nationstar Mortgage Llc
Bought by
Federal National Mortgage Association
Purchase Details
Closed on
Jun 26, 2007
Sold by
Lawrence Patricia A
Bought by
Hathaway Michelle Lynn
Home Financials for this Owner
Home Financials are based on the most recent Mortgage that was taken out on this home.
Original Mortgage
$87,300
Interest Rate
6.54%
Mortgage Type
Purchase Money Mortgage
Purchase Details
Closed on
Jul 6, 2005
Sold by
Lawrence Patricia A
Bought by
Lawrence Patricia A
Create a Home Valuation Report for This Property
The Home Valuation Report is an in-depth analysis detailing your home's value as well as a comparison with similar homes in the area
Home Values in the Area
Average Home Value in this Area
Purchase History
| Date | Buyer | Sale Price | Title Company |
|---|---|---|---|
| Second Chance Property Investments Llc | -- | None Available | |
| Wr Asset Trust | -- | None Available | |
| Camelback Ix Llc | -- | None Available | |
| Azcan Rpg Llc | $16,281 | None Available | |
| Nationstar Mortgage Llc | $128,832 | None Available | |
| Federal National Mortgage Association | -- | None Available | |
| Hathaway Michelle Lynn | $87,500 | Tri Title Agency Llc | |
| Lawrence Patricia A | -- | -- |
Source: Public Records
Mortgage History
| Date | Status | Borrower | Loan Amount |
|---|---|---|---|
| Previous Owner | Hathaway Michelle Lynn | $87,300 |
Source: Public Records
Tax History
| Year | Tax Paid | Tax Assessment Tax Assessment Total Assessment is a certain percentage of the fair market value that is determined by local assessors to be the total taxable value of land and additions on the property. | Land | Improvement |
|---|---|---|---|---|
| 2025 | $3,455 | $88,600 | $10,900 | $77,700 |
| 2024 | $28 | $80,200 | $10,900 | $69,300 |
| 2023 | $3,239 | $73,300 | $10,900 | $62,400 |
| 2022 | $2,918 | $62,700 | $10,000 | $52,700 |
| 2021 | $2,858 | $58,400 | $6,600 | $51,800 |
| 2020 | $2,840 | $55,700 | $6,600 | $49,100 |
| 2019 | $2,723 | $48,600 | $6,600 | $42,000 |
| 2018 | $2,551 | $45,200 | $6,600 | $38,600 |
| 2017 | $2,443 | $45,200 | $6,600 | $38,600 |
| 2016 | $2,340 | $44,400 | $6,600 | $37,800 |
| 2015 | $2,340 | $42,300 | $13,100 | $29,200 |
| 2014 | $2,340 | $41,700 | $10,189 | $31,511 |
Source: Public Records
Map
Nearby Homes
- 413 E Hodge Ave
- 320 E Hodge Ave
- 3140 S Cedar St
- 2418 Forest Ave
- 3149 Plymouth Dr
- 2340 S Pennsylvania Ave
- 2118 Roberts Ln
- 2305 Forest Ave
- 3319 Jewell Ave
- 215 Dunlap St
- 218 Dunlap St
- 114 W Berry Ave
- 704 Mckim Ave
- 328 W Greenlawn Ave
- 616 Glendale Ave
- 2201 S Pennsylvania Ave
- 334 Dunlap St
- 2215 Alpha St
- 410 Dunlap St
- 3603 Parkway Dr
Your Personal Tour Guide
Ask me questions while you tour the home.