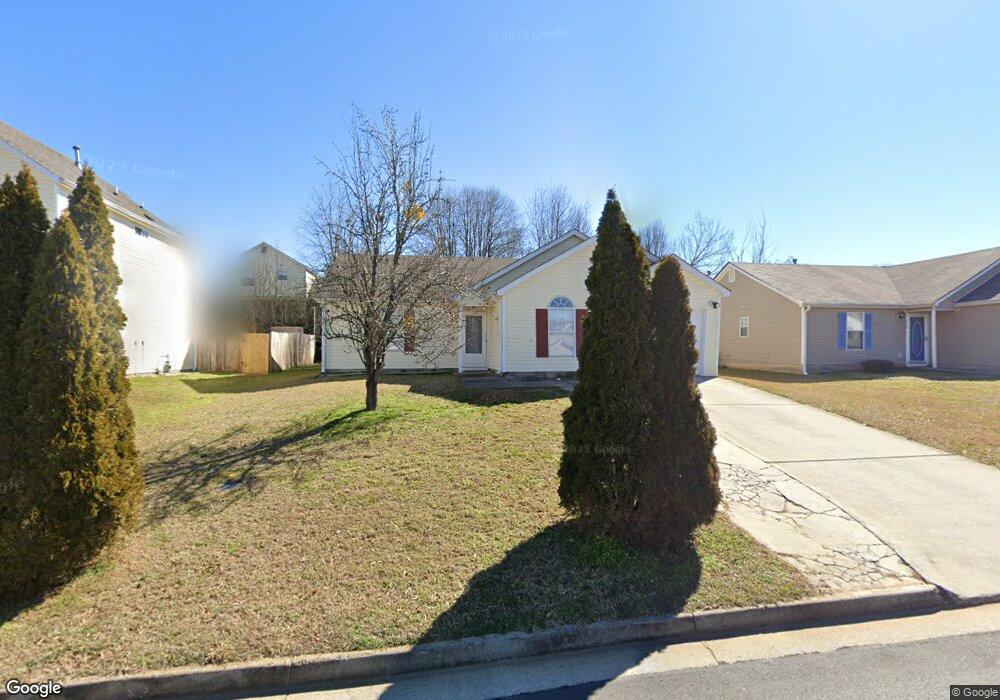
536 Eagles Crossing Cir Riverdale, GA 30274
Estimated Value: $226,000 - $266,000
3
Beds
2
Baths
1,344
Sq Ft
$177/Sq Ft
Est. Value
About This Home
This home is located at 536 Eagles Crossing Cir, Riverdale, GA 30274 and is currently estimated at $238,153, approximately $177 per square foot. 536 Eagles Crossing Cir is a home located in Clayton County with nearby schools including Riverdale Elementary School, Sequoyah Middle School, and Charles R. Drew High School.
Ownership History
Date
Name
Owned For
Owner Type
Purchase Details
Closed on
Apr 10, 2019
Sold by
Nguyen Thanh Thao Huynh
Bought by
Brown Lorenza Lee
Current Estimated Value
Home Financials for this Owner
Home Financials are based on the most recent Mortgage that was taken out on this home.
Original Mortgage
$91,962
Outstanding Balance
$81,756
Interest Rate
4.87%
Mortgage Type
FHA
Estimated Equity
$156,397
Purchase Details
Closed on
Nov 13, 2017
Sold by
Vanvannguyen Luc Van
Bought by
Nguyen Thanh Thao Huynh
Purchase Details
Closed on
Oct 27, 1999
Sold by
Gt Architecture Contractors Corp
Bought by
Nguyen Luc V and Nguyen Thao H
Home Financials for this Owner
Home Financials are based on the most recent Mortgage that was taken out on this home.
Original Mortgage
$75,100
Interest Rate
7.81%
Mortgage Type
New Conventional
Create a Home Valuation Report for This Property
The Home Valuation Report is an in-depth analysis detailing your home's value as well as a comparison with similar homes in the area
Home Values in the Area
Average Home Value in this Area
Purchase History
| Date | Buyer | Sale Price | Title Company |
|---|---|---|---|
| Brown Lorenza Lee | $100,000 | -- | |
| Nguyen Thanh Thao Huynh | $80,000 | -- | |
| Nguyen Luc V | $94,000 | -- |
Source: Public Records
Mortgage History
| Date | Status | Borrower | Loan Amount |
|---|---|---|---|
| Open | Brown Lorenza Lee | $91,962 | |
| Previous Owner | Nguyen Luc V | $75,100 |
Source: Public Records
Tax History Compared to Growth
Tax History
| Year | Tax Paid | Tax Assessment Tax Assessment Total Assessment is a certain percentage of the fair market value that is determined by local assessors to be the total taxable value of land and additions on the property. | Land | Improvement |
|---|---|---|---|---|
| 2024 | $3,326 | $94,280 | $8,000 | $86,280 |
| 2023 | $3,278 | $90,800 | $8,000 | $82,800 |
| 2022 | $2,283 | $67,200 | $8,000 | $59,200 |
| 2021 | $1,673 | $51,400 | $8,000 | $43,400 |
| 2020 | $1,238 | $40,000 | $8,000 | $32,000 |
| 2019 | $1,708 | $41,132 | $6,400 | $34,732 |
| 2018 | $1,560 | $37,489 | $6,400 | $31,089 |
| 2017 | $1,208 | $28,762 | $6,400 | $22,362 |
| 2016 | $1,101 | $26,125 | $6,400 | $19,725 |
| 2015 | $1,083 | $0 | $0 | $0 |
| 2014 | $748 | $17,848 | $6,400 | $11,448 |
Source: Public Records
Map
Nearby Homes
- 425 Eagles Flight Ln
- 416 Eagles Flight Ln
- 6127 Pinegrove Rd
- 6501 River Run Rd Unit 3
- 807 Boston Common
- 834 Pine Shoals Ct
- 545 Oak Valley Dr
- 6332 Valley Dale Dr
- 556 Roy Huie Rd
- 742 Verde Dr
- 6372 Valley Dale Dr
- 5517 Rock Shoals Way
- 772 Verde Dr
- 811 Verde Dr
- 222 Roy Huie Rd
- 5582 Windwood Rd
- 5591 Windwood Rd Unit 2
- 5488 Windwood Rd
- 5575 Pine Gate Dr
- 172 Scarsdale Dr
- 530 Eagles Crossing Cir
- 530 Eagles Crossing Cir Unit 94
- 542 Eagles Crossing Cir
- 5897 Eagles Crossing Ln
- 5899 Eagles Crossing Ln
- 5891 Eagles Crossing Ln
- 5903 Eagles Crossing Ln
- 524 Eagles Crossing Cir Unit 1
- 548 Eagles Crossing Cir
- 548 Eagles Crossing Cir
- 548 Eagles Xg Cr
- 5885 Eagles Crossing Ln
- 5909 Eagles Crossing Ln
- 533 Eagles Crossing Cir
- 539 Eagles Crossing Cir Unit 1
- 518 Eagles Crossing Cir
- 554 Eagles Crossing Cir
- 527 Eagles Crossing Cir Unit 1
- 545 Eagles Crossing Cir
- 5879 Eagles Crossing Ln