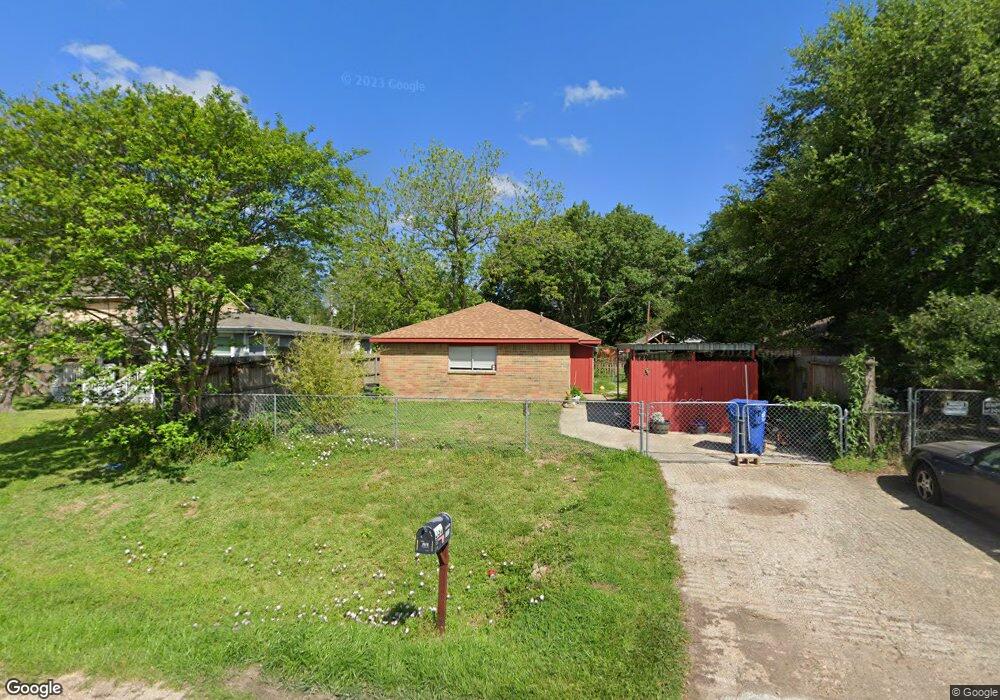
536 Foster St Tomball, TX 77375
Estimated Value: $216,575 - $280,000
3
Beds
1
Bath
956
Sq Ft
$264/Sq Ft
Est. Value
About This Home
This home is located at 536 Foster St, Tomball, TX 77375 and is currently estimated at $252,644, approximately $264 per square foot. 536 Foster St is a home located in Harris County with nearby schools including Tomball Elementary School, Tomball Intermediate School, and Tomball Junior High School.
Ownership History
Date
Name
Owned For
Owner Type
Purchase Details
Closed on
Apr 13, 1998
Sold by
Gelsomini Jesse Joseph and Gelsomini Deloris Donadee
Bought by
Hopkins Matthew D
Current Estimated Value
Home Financials for this Owner
Home Financials are based on the most recent Mortgage that was taken out on this home.
Original Mortgage
$166,800
Outstanding Balance
$32,024
Interest Rate
7.23%
Estimated Equity
$220,620
Create a Home Valuation Report for This Property
The Home Valuation Report is an in-depth analysis detailing your home's value as well as a comparison with similar homes in the area
Home Values in the Area
Average Home Value in this Area
Purchase History
| Date | Buyer | Sale Price | Title Company |
|---|---|---|---|
| Hopkins Matthew D | -- | Stewart Title Company |
Source: Public Records
Mortgage History
| Date | Status | Borrower | Loan Amount |
|---|---|---|---|
| Open | Hopkins Matthew D | $166,800 | |
| Closed | Hopkins Matthew D | $20,850 |
Source: Public Records
Tax History Compared to Growth
Tax History
| Year | Tax Paid | Tax Assessment Tax Assessment Total Assessment is a certain percentage of the fair market value that is determined by local assessors to be the total taxable value of land and additions on the property. | Land | Improvement |
|---|---|---|---|---|
| 2025 | $2,815 | $243,849 | $105,000 | $138,849 |
| 2024 | $2,815 | $239,194 | $98,000 | $141,194 |
| 2023 | $2,815 | $227,539 | $84,000 | $143,539 |
| 2022 | $3,469 | $187,090 | $63,000 | $124,090 |
| 2021 | $3,318 | $143,147 | $45,500 | $97,647 |
| 2020 | $3,119 | $140,340 | $35,000 | $105,340 |
| 2019 | $2,916 | $119,618 | $28,000 | $91,618 |
| 2018 | $1,073 | $105,100 | $28,000 | $77,100 |
| 2017 | $2,516 | $110,484 | $28,000 | $82,484 |
| 2016 | $2,287 | $110,484 | $28,000 | $82,484 |
| 2015 | $1,604 | $110,484 | $28,000 | $82,484 |
| 2014 | $1,604 | $75,000 | $28,000 | $47,000 |
Source: Public Records
Map
Nearby Homes
- 532 Carrell St
- 1114 Buffalo Run
- Lot 46 Moore St
- Lot 45 Moore St
- 650 Texas St
- 1123 Magnolia Branch Ln
- 1046 Bending Trail Dr
- 306 E Main St
- 1107 Grand Junction Dr
- 0 Mechanic Unit 5403633
- 0 Mechanic Unit 33031741
- lt 19 Mechanic Rd
- TBD Mechanic St
- 315 Mechanic St
- 0 N Sycamore St
- 0 Ash St
- 0 Holiday St
- 803 Junction Point Ln
- 429 Ash St
- 20734 Open Range Ct
- 536 Foster St Unit 1
- 538 Foster St
- 534 Foster St
- 403 N Howard St Unit 2
- 505 Carrell St
- 507 Carrell St
- 503 Carrell St
- 401 N Willow St
- 501 Carrell St
- 521 Carrell St
- 420 -1 Foster St Unit 1
- 420 Foster St
- 420 Foster St Unit 1
- 414 Foster St
- 414 N Howard St
- 425 Foster St
- 518 Moore St
- LT Carrell St
- 602 N Willow St
- 514 Moore St