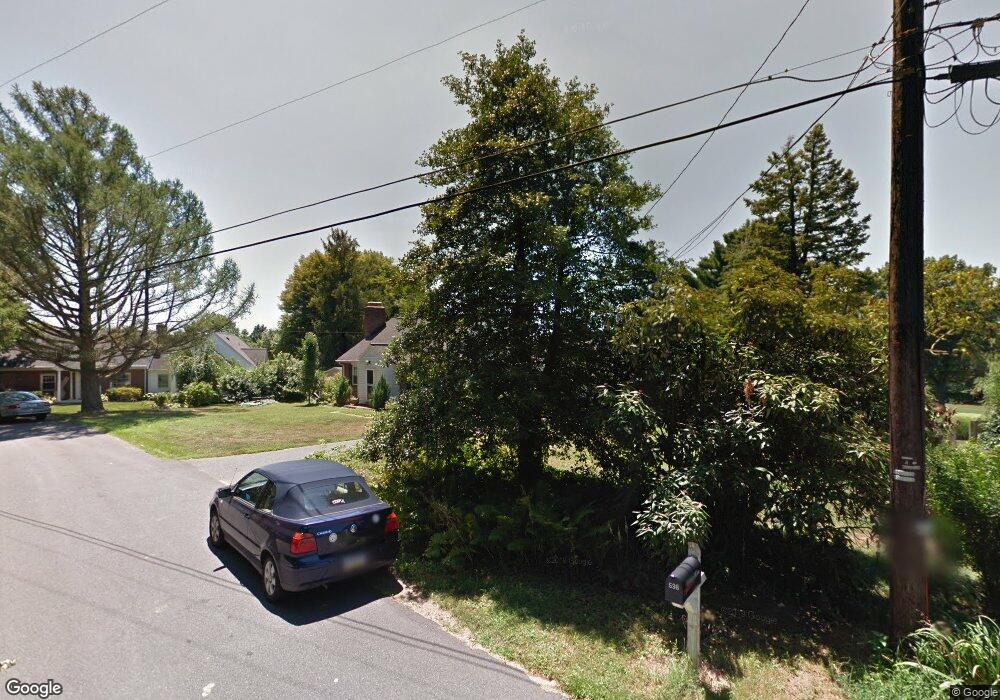
536 Garden Hill Ln Lancaster, PA 17603
Wheatland NeighborhoodEstimated Value: $338,804 - $391,000
2
Beds
2
Baths
1,248
Sq Ft
$295/Sq Ft
Est. Value
About This Home
This home is located at 536 Garden Hill Ln, Lancaster, PA 17603 and is currently estimated at $367,951, approximately $294 per square foot. 536 Garden Hill Ln is a home located in Lancaster County with nearby schools including Hambright Elementary School, Manor Middle School, and Penn Manor High School.
Ownership History
Date
Name
Owned For
Owner Type
Purchase Details
Closed on
Oct 22, 2016
Sold by
Grant Donald T
Bought by
Grant Donald T and Grant Holly
Current Estimated Value
Purchase Details
Closed on
Sep 28, 2007
Sold by
Schwartz Timothy J and Schwartz Elizabeth A
Bought by
Grant Donald T
Home Financials for this Owner
Home Financials are based on the most recent Mortgage that was taken out on this home.
Original Mortgage
$168,000
Outstanding Balance
$107,285
Interest Rate
6.65%
Mortgage Type
Purchase Money Mortgage
Estimated Equity
$260,666
Purchase Details
Closed on
Apr 28, 2005
Sold by
Stauffer Glenn C and Stauffer Anna L
Bought by
Schwartz Timothy J and Schwartz Elizabeth A
Home Financials for this Owner
Home Financials are based on the most recent Mortgage that was taken out on this home.
Original Mortgage
$112,720
Interest Rate
5.95%
Mortgage Type
Purchase Money Mortgage
Create a Home Valuation Report for This Property
The Home Valuation Report is an in-depth analysis detailing your home's value as well as a comparison with similar homes in the area
Home Values in the Area
Average Home Value in this Area
Purchase History
| Date | Buyer | Sale Price | Title Company |
|---|---|---|---|
| Grant Donald T | -- | First Source Title | |
| Grant Donald T | $210,000 | United General Title Ins Co | |
| Schwartz Timothy J | $140,900 | -- |
Source: Public Records
Mortgage History
| Date | Status | Borrower | Loan Amount |
|---|---|---|---|
| Open | Grant Donald T | $168,000 | |
| Previous Owner | Schwartz Timothy J | $112,720 |
Source: Public Records
Tax History Compared to Growth
Tax History
| Year | Tax Paid | Tax Assessment Tax Assessment Total Assessment is a certain percentage of the fair market value that is determined by local assessors to be the total taxable value of land and additions on the property. | Land | Improvement |
|---|---|---|---|---|
| 2025 | $4,003 | $183,300 | $65,400 | $117,900 |
| 2024 | $4,003 | $183,300 | $65,400 | $117,900 |
| 2023 | $4,003 | $183,300 | $65,400 | $117,900 |
| 2022 | $3,927 | $183,300 | $65,400 | $117,900 |
| 2021 | $3,827 | $183,300 | $65,400 | $117,900 |
| 2020 | $3,827 | $183,300 | $65,400 | $117,900 |
| 2019 | $3,721 | $183,300 | $65,400 | $117,900 |
| 2018 | $2,886 | $183,300 | $65,400 | $117,900 |
| 2017 | $3,615 | $149,000 | $43,600 | $105,400 |
| 2016 | $3,615 | $149,000 | $43,600 | $105,400 |
| 2015 | $744 | $149,000 | $43,600 | $105,400 |
| 2014 | $2,505 | $149,000 | $43,600 | $105,400 |
Source: Public Records
Map
Nearby Homes
- 108 Wildbriar Ct S
- 109 Falcon Ct
- 105 Silverwind Ct S
- 619 + 621 Millersville Rd
- 1799 Heritage Ave
- 129 Joseph Rd
- 118 Bentley Ln
- 114 Pheasant Ridge Cir
- 220 Harvard Ave
- 111 Pheasant Ridge Cir
- 2008 Manor Ridge Dr
- 171 Harvard Ave
- 4 Bunker Hill
- 203 Oakfield Ct W
- 106 Longwood Ct E
- 2205 Berkshire Rd
- 2210 Berkshire Rd
- 34 Girard Ave
- 1761 Wilson Ave
- 1 & 2 Bentley Ln
- 542 Garden Hill Ln
- 530 Garden Hill Ln
- 537 Garden Hill Ln
- 524 Garden Hill Ln
- 543 Garden Hill Ln
- 531 Garden Hill Ln
- 550 Garden Hill Ln
- 518 Garden Hill Ln
- 513 Garden Hill Ln
- 512 Garden Hill Ln
- 501 Garden Hill Ln
- 506 Garden Hill Ln
- 500 Garden Hill Ln
- 146 Greenbriar Cir
- 509 Fairway Dr
- 507 Fairway Dr
- 1989 Stone Mill Rd
- 603 Fairway Dr
- 150 Greenbriar Cir
- 144 Greenbriar Cir