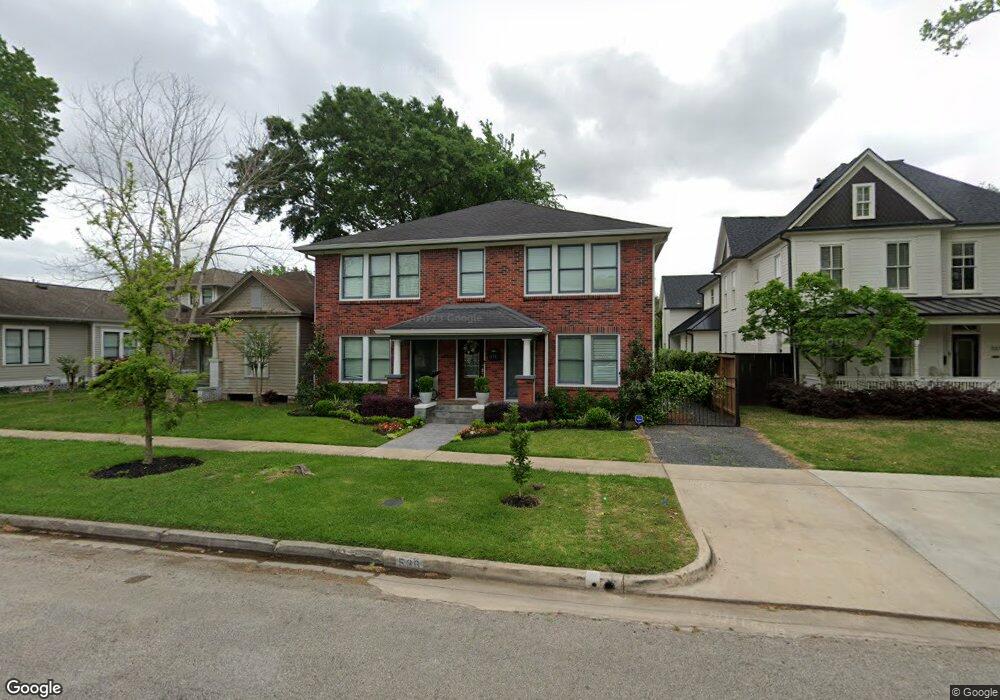
536 Harvard St Unit 4 Houston, TX 77007
Greater Heights NeighborhoodEstimated Value: $1,361,000 - $1,701,000
4
Beds
4
Baths
3,450
Sq Ft
$440/Sq Ft
Est. Value
About This Home
This home is located at 536 Harvard St Unit 4, Houston, TX 77007 and is currently estimated at $1,516,766, approximately $439 per square foot. 536 Harvard St Unit 4 is a home located in Harris County with nearby schools including Harvard Elementary School, Hogg Middle, and Heights High School.
Ownership History
Date
Name
Owned For
Owner Type
Purchase Details
Closed on
Apr 12, 2016
Sold by
Rallis Llc
Bought by
Orbegoso Luis Jose De and Orbegoso Brittany N De
Current Estimated Value
Home Financials for this Owner
Home Financials are based on the most recent Mortgage that was taken out on this home.
Original Mortgage
$731,250
Interest Rate
3.64%
Mortgage Type
New Conventional
Purchase Details
Closed on
Mar 27, 2014
Sold by
Harkor Homes Llc
Bought by
Rallis Llc and Olympic Rei
Purchase Details
Closed on
Jul 6, 1998
Sold by
Troxell Troy Neal and Troxell Tobi Alexia
Bought by
Weining John J
Home Financials for this Owner
Home Financials are based on the most recent Mortgage that was taken out on this home.
Original Mortgage
$15,000
Interest Rate
7.13%
Mortgage Type
Seller Take Back
Purchase Details
Closed on
Dec 30, 1993
Sold by
Troxell Troy Neal and Hale Isabel T
Bought by
Troxell Tricia Leigh
Create a Home Valuation Report for This Property
The Home Valuation Report is an in-depth analysis detailing your home's value as well as a comparison with similar homes in the area
Home Values in the Area
Average Home Value in this Area
Purchase History
| Date | Buyer | Sale Price | Title Company |
|---|---|---|---|
| Orbegoso Luis Jose De | -- | Stewart Title | |
| Rallis Llc | -- | Providence Title | |
| Harkor Homes Llc | -- | Providence Title | |
| Harkor Homes Llc | -- | Providence Title | |
| Weining John J | -- | Commonwealth Land Title Co | |
| Troxell Tricia Leigh | -- | -- |
Source: Public Records
Mortgage History
| Date | Status | Borrower | Loan Amount |
|---|---|---|---|
| Closed | Orbegoso Luis Jose De | $731,250 | |
| Previous Owner | Weining John J | $15,000 |
Source: Public Records
Tax History Compared to Growth
Tax History
| Year | Tax Paid | Tax Assessment Tax Assessment Total Assessment is a certain percentage of the fair market value that is determined by local assessors to be the total taxable value of land and additions on the property. | Land | Improvement |
|---|---|---|---|---|
| 2025 | $27,553 | $1,476,387 | $660,000 | $816,387 |
| 2024 | $27,553 | $1,316,842 | $495,000 | $821,842 |
| 2023 | $27,553 | $1,408,279 | $462,000 | $946,279 |
| 2022 | $23,484 | $1,066,534 | $462,000 | $604,534 |
| 2021 | $23,889 | $1,025,000 | $429,000 | $596,000 |
| 2020 | $23,221 | $958,933 | $429,000 | $529,933 |
| 2019 | $24,039 | $950,000 | $429,000 | $521,000 |
| 2018 | $20,030 | $884,172 | $462,000 | $422,172 |
| 2017 | $24,021 | $950,000 | $462,000 | $488,000 |
| 2016 | $24,925 | $985,753 | $396,000 | $589,753 |
| 2015 | $9,295 | $375,873 | $330,000 | $45,873 |
| 2014 | $9,295 | $361,567 | $316,800 | $44,767 |
Source: Public Records
Map
Nearby Homes
- 535 Arlington St
- 515 Arlington St
- 516 Arlington St
- 420 Heights Blvd
- 415 Arlington St
- 610 Columbia St
- 401 Arlington St
- 3201 White Oak Dr
- 338 Cortlandt St
- 403 Columbia St
- 510 E 7th St
- 333 Heights Blvd
- 406 Columbia St
- 402 Columbia St
- 550 Oxford St
- 404 Columbia St
- 311 W 6th St
- 220 E 8th St
- 515 E 4th St
- 517 E 4th St
- 536 Harvard St
- 540 Harvard St
- 532 Harvard St
- 544 Harvard St
- 530 Harvard St
- 533 Cortlandt St
- 537 Cortlandt St
- 529 Cortlandt St
- 528 Harvard St
- 547 Cortlandt St
- 535 Harvard St
- 518 Harvard St
- 3501 White Oak Dr
- 523 Cortlandt St
- 531 Harvard St
- 539 Harvard St
- 539 Harvard St Unit .05
- 527 Harvard St
- 549 Cortlandt St
- 512 Harvard St