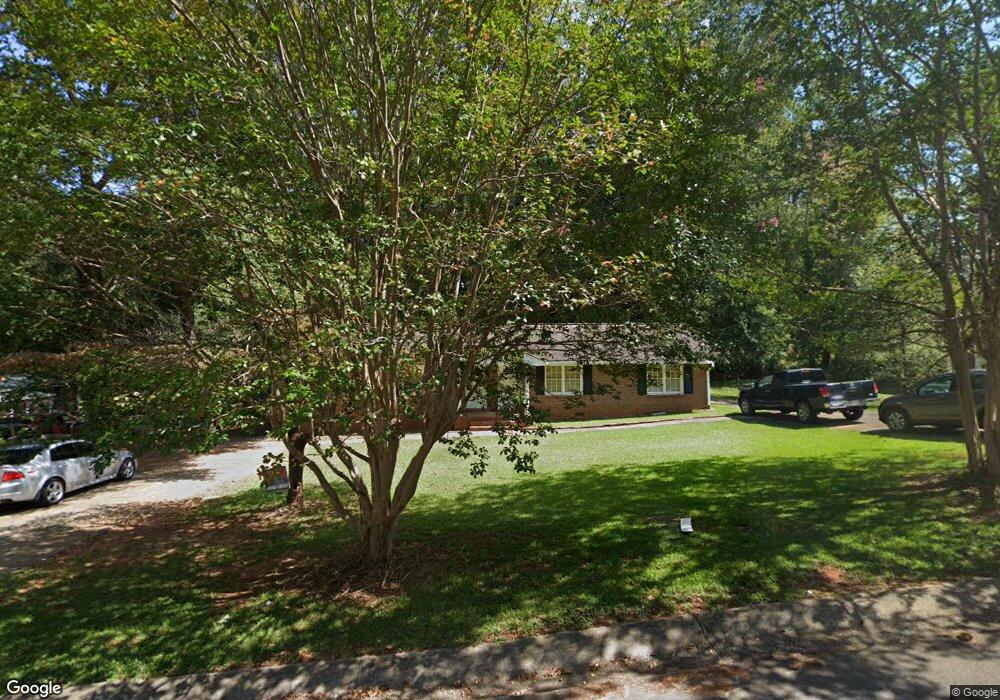
536 Johns Way NW Lilburn, GA 30047
Estimated Value: $327,009 - $443,000
4
Beds
2
Baths
1,730
Sq Ft
$220/Sq Ft
Est. Value
About This Home
This home is located at 536 Johns Way NW, Lilburn, GA 30047 and is currently estimated at $381,252, approximately $220 per square foot. 536 Johns Way NW is a home located in Gwinnett County with nearby schools including Minor Elementary School, Berkmar Middle School, and Berkmar High School.
Ownership History
Date
Name
Owned For
Owner Type
Purchase Details
Closed on
Dec 5, 2008
Sold by
Fremont Home Trust 2006-1
Bought by
Nguyen Huong
Current Estimated Value
Home Financials for this Owner
Home Financials are based on the most recent Mortgage that was taken out on this home.
Original Mortgage
$97,200
Interest Rate
5.95%
Mortgage Type
New Conventional
Purchase Details
Closed on
Aug 5, 2008
Sold by
Ramirez Jose L
Bought by
Fremont Home Loan Trust 2006-1
Purchase Details
Closed on
Feb 25, 2006
Sold by
Aragon Jose A and Aragon Delis
Bought by
Ramirez Jose L
Home Financials for this Owner
Home Financials are based on the most recent Mortgage that was taken out on this home.
Original Mortgage
$130,960
Interest Rate
7.4%
Mortgage Type
New Conventional
Purchase Details
Closed on
Jun 29, 1998
Sold by
Keller Marjorie
Bought by
Coleman Frank J
Home Financials for this Owner
Home Financials are based on the most recent Mortgage that was taken out on this home.
Original Mortgage
$98,949
Interest Rate
7.1%
Mortgage Type
FHA
Create a Home Valuation Report for This Property
The Home Valuation Report is an in-depth analysis detailing your home's value as well as a comparison with similar homes in the area
Home Values in the Area
Average Home Value in this Area
Purchase History
| Date | Buyer | Sale Price | Title Company |
|---|---|---|---|
| Nguyen Huong | $121,500 | -- | |
| Fremont Home Loan Trust 2006-1 | $96,600 | -- | |
| Ramirez Jose L | $163,700 | -- | |
| Coleman Frank J | $99,000 | -- |
Source: Public Records
Mortgage History
| Date | Status | Borrower | Loan Amount |
|---|---|---|---|
| Closed | Nguyen Huong | $97,200 | |
| Previous Owner | Ramirez Jose L | $130,960 | |
| Previous Owner | Coleman Frank J | $98,949 |
Source: Public Records
Tax History Compared to Growth
Tax History
| Year | Tax Paid | Tax Assessment Tax Assessment Total Assessment is a certain percentage of the fair market value that is determined by local assessors to be the total taxable value of land and additions on the property. | Land | Improvement |
|---|---|---|---|---|
| 2024 | $5,002 | $120,560 | $21,120 | $99,440 |
| 2023 | $5,002 | $112,360 | $24,800 | $87,560 |
| 2022 | $4,038 | $95,760 | $24,800 | $70,960 |
| 2021 | $3,647 | $84,160 | $19,200 | $64,960 |
| 2020 | $3,581 | $81,920 | $15,200 | $66,720 |
| 2019 | $3,236 | $75,600 | $15,200 | $60,400 |
| 2018 | $2,911 | $66,640 | $13,400 | $53,240 |
| 2016 | $2,428 | $51,760 | $9,600 | $42,160 |
| 2015 | $1,468 | $30,000 | $6,000 | $24,000 |
| 2014 | -- | $30,000 | $6,000 | $24,000 |
Source: Public Records
Map
Nearby Homes
- 4082 Johns St NW
- 642 Huntington Way NW
- 4100 Bradstone Trace NW Unit 1
- 3975 Bradstone Trace NW
- 566 Jody Place
- 0 Lawrenceville Hwy NW Unit 7662367
- 0 Lawrenceville Hwy NW Unit 10618125
- 3911 Millwood Ln NW
- 3951 Millwood Ln NW
- 3706 Charles St NW
- 4450 Bradstone Trace NW Unit 2
- 1118 Saybrook Cir NW
- 881 Huntington Way NW
- 918 Hampton Trail NW
- 805 Pleasant Hill Rd NW Unit 212
- 805 Pleasant Hill Rd NW Unit 703
- 805 Pleasant Hill Rd NW Unit 13-2
- 805 Pleasant Hill Rd NW Unit 53
- 805 Pleasant Hill Rd NW Unit 503
- 748 Pleasant Hill Rd NW
- 526 Johns Way NW
- 0 Johns Way NW Unit 3200781
- 0 Johns Way NW Unit 7503141
- 0 Johns Way NW Unit 7293836
- 0 Johns Way NW
- 3996 Burns Rd NW
- 3986 Burns Rd NW Unit 5
- 3986 Burns Rd NW
- 4006 Burns Rd NW
- 3976 Burns Rd NW
- 537 Johns Way NW
- 3993 Johns St NW
- 3983 Johns St NW
- 4003 Johns St NW Unit 9
- 4003 Johns St NW
- 547 Johns Way NW Unit 1
- 3973 Johns St NW
- 3966 Burns Rd NW
- 4016 Burns Rd NW
- 566 Johns Way NW Unit 1