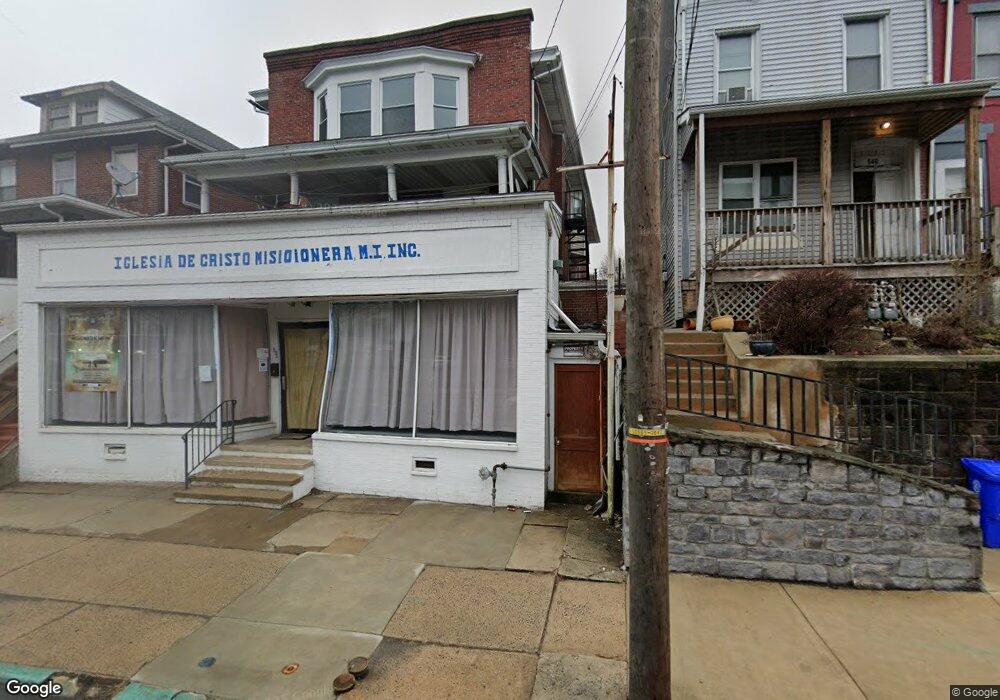
536 Lancaster Ave Reading, PA 19611
Estimated Value: $390,000 - $532,000
--
Bed
--
Bath
5,000
Sq Ft
$88/Sq Ft
Est. Value
About This Home
This home is located at 536 Lancaster Ave, Reading, PA 19611 and is currently estimated at $441,478, approximately $88 per square foot. 536 Lancaster Ave is a home located in Berks County with nearby schools including Millmont Elementary School, Central Middle School, and Reading Senior High School.
Ownership History
Date
Name
Owned For
Owner Type
Purchase Details
Closed on
Jul 20, 2021
Sold by
Case & Shah Llc
Bought by
Chen Jinlei
Current Estimated Value
Home Financials for this Owner
Home Financials are based on the most recent Mortgage that was taken out on this home.
Original Mortgage
$208,125
Outstanding Balance
$188,928
Interest Rate
2.93%
Mortgage Type
Future Advance Clause Open End Mortgage
Estimated Equity
$252,550
Purchase Details
Closed on
Oct 18, 2011
Sold by
Haney Mark K
Bought by
Case & Shah Llc
Home Financials for this Owner
Home Financials are based on the most recent Mortgage that was taken out on this home.
Original Mortgage
$112,500
Interest Rate
4.11%
Mortgage Type
Future Advance Clause Open End Mortgage
Purchase Details
Closed on
Feb 28, 2007
Sold by
Fix Michael D and Fix Mary Louise
Bought by
Haney Mary K
Home Financials for this Owner
Home Financials are based on the most recent Mortgage that was taken out on this home.
Original Mortgage
$151,540
Interest Rate
6.27%
Mortgage Type
Commercial
Create a Home Valuation Report for This Property
The Home Valuation Report is an in-depth analysis detailing your home's value as well as a comparison with similar homes in the area
Home Values in the Area
Average Home Value in this Area
Purchase History
| Date | Buyer | Sale Price | Title Company |
|---|---|---|---|
| Chen Jinlei | $277,500 | Edge Abstract | |
| Case & Shah Llc | $150,000 | None Available | |
| Haney Mary K | $179,900 | Conestoga Title Insurance |
Source: Public Records
Mortgage History
| Date | Status | Borrower | Loan Amount |
|---|---|---|---|
| Open | Chen Jinlei | $208,125 | |
| Previous Owner | Case & Shah Llc | $112,500 | |
| Previous Owner | Haney Mary K | $151,540 |
Source: Public Records
Tax History Compared to Growth
Tax History
| Year | Tax Paid | Tax Assessment Tax Assessment Total Assessment is a certain percentage of the fair market value that is determined by local assessors to be the total taxable value of land and additions on the property. | Land | Improvement |
|---|---|---|---|---|
| 2025 | $3,577 | $131,800 | $64,200 | $67,600 |
| 2024 | $5,852 | $131,800 | $64,200 | $67,600 |
| 2023 | $5,762 | $131,800 | $64,200 | $67,600 |
| 2022 | $5,762 | $131,800 | $64,200 | $67,600 |
| 2021 | $5,762 | $131,800 | $64,200 | $67,600 |
| 2020 | $5,704 | $131,800 | $64,200 | $67,600 |
| 2019 | $5,704 | $131,800 | $64,200 | $67,600 |
| 2018 | $5,704 | $131,800 | $64,200 | $67,600 |
| 2017 | $5,666 | $131,800 | $64,200 | $67,600 |
| 2016 | $3,237 | $131,800 | $64,200 | $67,600 |
| 2015 | $3,237 | $131,800 | $64,200 | $67,600 |
| 2014 | $2,979 | $131,800 | $64,200 | $67,600 |
Source: Public Records
Map
Nearby Homes
- 29 Angelica St
- 619 Gregg Ave
- 127 Angelica St
- 728 Lancaster Ave
- 209 Carroll St
- 214 Gerry St
- 1020 Meade St
- 201 Upland Ave
- 402 Morgantown Rd
- 1028 Broadway Blvd
- 408 Hazel St
- 1145 Gregg Ave
- 810 Joan Tc
- 430 Bingaman Ct
- 1131 Broadway Blvd
- 612 Minor St
- 510 Laurel St
- 609 Minor St
- 1234 Brooke Blvd
- 323 Pine St
- 540 Lancaster Ave
- 526 Lancaster Ave
- 542 Lancaster Ave
- 544 Lancaster Ave
- 546 Lancaster Ave
- 548 Lancaster Ave
- 524 Lancaster Ave
- 550 Lancaster Ave
- 552 Lancaster Ave
- 554 Lancaster Ave
- 531 Fern Ave
- 529 Fern Ave
- 527 Fern Ave
- 533 Fern Ave
- 525 Fern Ave
- 523 Fern Ave
- 537 Fern Ave
- 539 Fern Ave
- 521 Fern Ave
- 541 Fern Ave