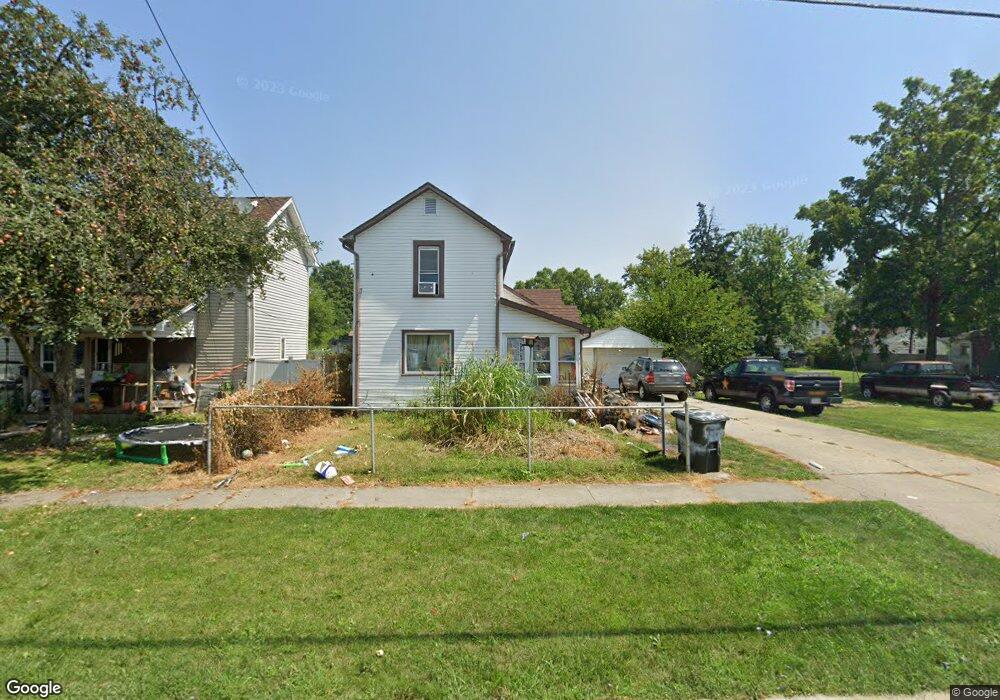
536 Lee St Marion, OH 43302
Estimated Value: $90,715 - $138,000
3
Beds
1
Bath
1,442
Sq Ft
$74/Sq Ft
Est. Value
About This Home
This home is located at 536 Lee St, Marion, OH 43302 and is currently estimated at $106,429, approximately $73 per square foot. 536 Lee St is a home located in Marion County with nearby schools including Rutherford B. Hayes Elementary School, Ulysses S. Grant Middle School, and Harding High School.
Ownership History
Date
Name
Owned For
Owner Type
Purchase Details
Closed on
Apr 4, 2010
Sold by
Secretary Of Housing And Urban Devel
Bought by
Lower Bruce L and Lower Jeanette M
Current Estimated Value
Purchase Details
Closed on
Jan 4, 2010
Sold by
Bac Home Loans Servicing Lp
Bought by
Secretary Of Housing & Urban Development
Purchase Details
Closed on
Dec 17, 2009
Sold by
Walter Cindy M
Bought by
Bac Home Loans Servicing Lp and Countrywide Home Loans Servicing Lp
Purchase Details
Closed on
Jan 13, 2005
Sold by
Smith Paul David
Bought by
Walter Cindy M
Home Financials for this Owner
Home Financials are based on the most recent Mortgage that was taken out on this home.
Original Mortgage
$66,000
Interest Rate
8.25%
Mortgage Type
Adjustable Rate Mortgage/ARM
Purchase Details
Closed on
Dec 9, 1998
Bought by
Lower Bruce L & Jeannette M Sur
Create a Home Valuation Report for This Property
The Home Valuation Report is an in-depth analysis detailing your home's value as well as a comparison with similar homes in the area
Home Values in the Area
Average Home Value in this Area
Purchase History
| Date | Buyer | Sale Price | Title Company |
|---|---|---|---|
| Lower Bruce L | -- | Multiple | |
| Secretary Of Housing & Urban Development | -- | Ohio Title Corp | |
| Bac Home Loans Servicing Lp | $30,000 | None Available | |
| Walter Cindy M | $66,000 | Aarcher Land Title Inc | |
| Lower Bruce L & Jeannette M Sur | $5,000 | -- |
Source: Public Records
Mortgage History
| Date | Status | Borrower | Loan Amount |
|---|---|---|---|
| Previous Owner | Walter Cindy M | $66,000 |
Source: Public Records
Tax History
| Year | Tax Paid | Tax Assessment Tax Assessment Total Assessment is a certain percentage of the fair market value that is determined by local assessors to be the total taxable value of land and additions on the property. | Land | Improvement |
|---|---|---|---|---|
| 2025 | $1,813 | $27,010 | $1,830 | $25,180 |
| 2024 | $1,813 | $20,510 | $1,740 | $18,770 |
| 2023 | $1,813 | $20,510 | $1,740 | $18,770 |
| 2022 | $1,222 | $20,510 | $1,740 | $18,770 |
| 2021 | $792 | $15,990 | $1,510 | $14,480 |
| 2020 | $950 | $15,990 | $1,510 | $14,480 |
| 2019 | $635 | $15,990 | $1,510 | $14,480 |
| 2018 | $1,012 | $15,450 | $1,480 | $13,970 |
| 2017 | $942 | $15,450 | $1,480 | $13,970 |
| 2016 | $617 | $15,450 | $1,480 | $13,970 |
| 2015 | $616 | $15,100 | $1,410 | $13,690 |
| 2014 | $618 | $15,100 | $1,410 | $13,690 |
| 2012 | $731 | $18,270 | $1,500 | $16,770 |
Source: Public Records
Map
Nearby Homes
Your Personal Tour Guide
Ask me questions while you tour the home.