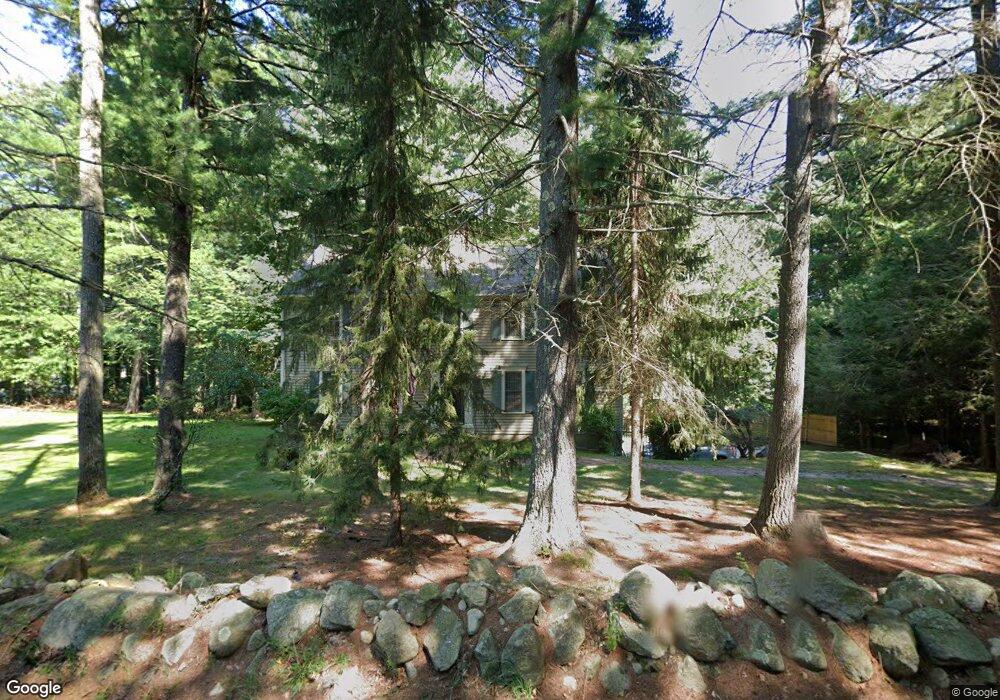
536 Marshall St Holliston, MA 01746
Estimated Value: $879,284 - $1,028,000
4
Beds
3
Baths
2,485
Sq Ft
$379/Sq Ft
Est. Value
About This Home
This home is located at 536 Marshall St, Holliston, MA 01746 and is currently estimated at $942,321, approximately $379 per square foot. 536 Marshall St is a home located in Middlesex County with nearby schools including Placentino Elementary School, Miller Elementary School, and Robert H. Adams Middle School.
Ownership History
Date
Name
Owned For
Owner Type
Purchase Details
Closed on
Mar 14, 1997
Sold by
Christensen Lawrence J and Christensen Barbara A
Bought by
Powell Alan C and Powell Mary Martha
Current Estimated Value
Home Financials for this Owner
Home Financials are based on the most recent Mortgage that was taken out on this home.
Original Mortgage
$200,000
Outstanding Balance
$24,361
Interest Rate
7.79%
Mortgage Type
Purchase Money Mortgage
Estimated Equity
$917,960
Create a Home Valuation Report for This Property
The Home Valuation Report is an in-depth analysis detailing your home's value as well as a comparison with similar homes in the area
Home Values in the Area
Average Home Value in this Area
Purchase History
| Date | Buyer | Sale Price | Title Company |
|---|---|---|---|
| Powell Alan C | $285,000 | -- |
Source: Public Records
Mortgage History
| Date | Status | Borrower | Loan Amount |
|---|---|---|---|
| Open | Powell Alan C | $200,000 | |
| Previous Owner | Powell Alan C | $50,000 |
Source: Public Records
Tax History
| Year | Tax Paid | Tax Assessment Tax Assessment Total Assessment is a certain percentage of the fair market value that is determined by local assessors to be the total taxable value of land and additions on the property. | Land | Improvement |
|---|---|---|---|---|
| 2025 | $11,037 | $753,400 | $314,700 | $438,700 |
| 2024 | $11,090 | $736,400 | $314,700 | $421,700 |
| 2023 | $10,293 | $668,400 | $314,700 | $353,700 |
| 2022 | $10,826 | $622,900 | $314,700 | $308,200 |
| 2021 | $10,062 | $563,700 | $255,500 | $308,200 |
| 2020 | $9,457 | $501,700 | $228,300 | $273,400 |
| 2019 | $9,272 | $492,400 | $221,900 | $270,500 |
| 2018 | $9,193 | $492,400 | $221,900 | $270,500 |
| 2017 | $8,828 | $476,700 | $213,100 | $263,600 |
| 2016 | $8,461 | $450,300 | $186,700 | $263,600 |
| 2015 | $8,291 | $427,800 | $161,100 | $266,700 |
Source: Public Records
Map
Nearby Homes
- Lot 2 Hanlon Rd
- 75 Ridge Rd
- 358 Underwood St
- 4 Emerald Dr
- 2 Emerald Dr
- 1 Emerald Dr
- 1 Westfield Rd
- 96 Walden Way Unit 52
- 35 Peter St
- 4 Bullard Cir
- 5 Myrtle Ave Unit 2
- 7 Myrtle Ave Unit 3
- 23 Cedar Farms Rd
- 4 Myrtle Ave Unit 20
- 11 Myrtle Ave Unit 5
- 13 Fitch Ave Unit 19
- 16 Fitch Ave Unit 6
- 11 N Mill St
- 11 Fitch Ave Unit 18
- 14 Fitch Ave Unit 7
- 520 Marshall St
- 539 Marshall St
- 637 Gorwin Dr
- 571 Marshall St
- 504 Marshall St
- 617 Gorwin Dr
- 578 Marshall St
- 484 Marshall St
- 609 Gorwin Dr
- 680 Gorwin Drive Extension
- 607 Marshall St
- 705 Gorwin Drive Extension
- 464 Marshall St
- 610 Marshall St
- 601 Gorwin Dr
- 606 Gorwin Dr
- 696 Gorwin Drive Extension
- 616 Gorwin Dr
- 467 Marshall St
- 448 Marshall St