
Seller's Agent in 2025
Lindy Kurtz
Genstone Realty
(210) 633-7679
58 in this area
244 Total Sales
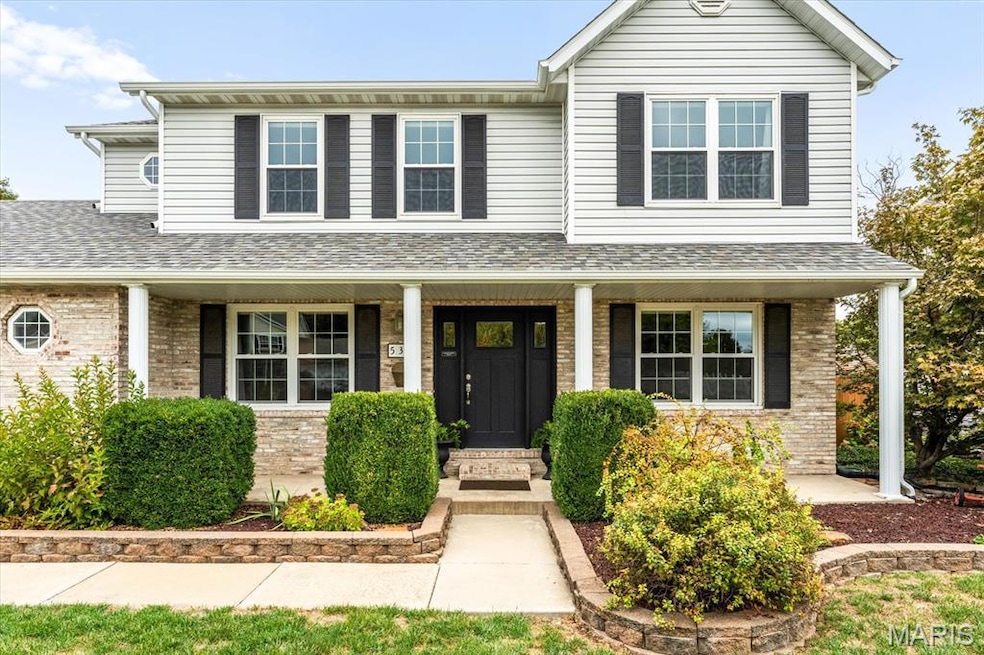
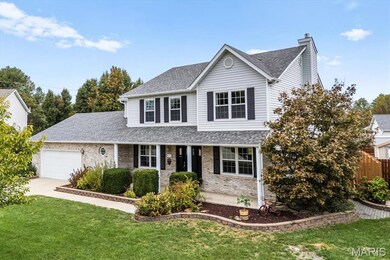
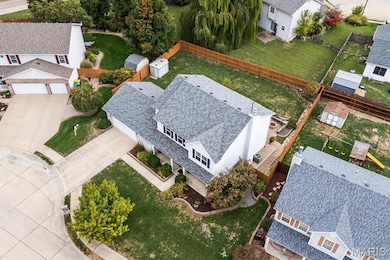
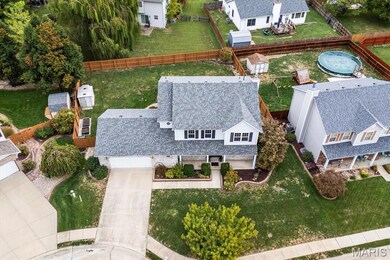
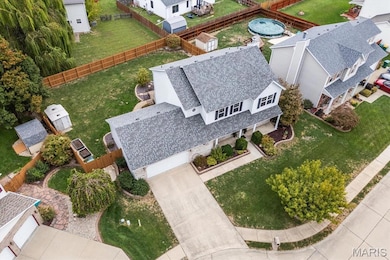
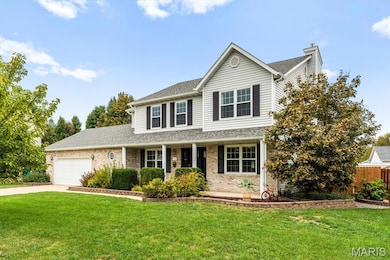

Welcome home to 536 Mercer Court! This beautiful 2-story, 4-bedroom, 4-bathroom residence offers spacious living with open floorplan for entertaining and everyday comfort. Through the craftsman style door, the foyer leads to an updated kitchen and family room. Hardwood floors, tile backsplash, granite countertops, stainless appliances, updated light fixtures and remodeled pantry! Spacious family room with updated stone and gas fireplace. Easy access to the large dining room with crown molding, hardwood floors and room for large dining suites. The formal living room can also serve as an office or study. Main level laundry with utility sink, extra shelving and convenient access to the oversized garage. Upstairs you will find all 4 bedrooms. Roomy primary bedroom and a fabulous remodeled primary bathroom with tile shower w/glass doors, comfort height vanities & toilet, and new flooring. There are 3 other spacious bedrooms w/either double or walk in closet and easy access to the hall bath. The lower level has a fully finished recreation room and bonus room with attached ¾ bathroom. Additional space is available in the basement for extra storage. The fully fenced backyard creates a space for morning coffee, evening firepits and grilling! Covered deck can be accessed through French doors off the kitchen, and leads to paved patios and walkway with mature landscape for additional privacy. Updates to all major systems have been made for you! Roof (2025), gutters (2025), HVAC (2023), water heater (2023), refrigerator (2024), dishwasher (2022). Nothing else for you to do but MOVE IN! You are close to parks, interstate access, Scott AFB, shopping, small town market/festivals and still 20 minutes to major league baseball! Come book a tour of this lovely, well maintained home!
Last Agent to Sell the Property
Genstone Realty License #471.021677 Listed on: 10/10/2025
| Date | Type | Sale Price | Title Company |
|---|---|---|---|
| Warranty Deed | $433,000 | Town & Country Title | |
| Warranty Deed | $253,000 | None Available | |
| Warranty Deed | $209,500 | Fati | |
| Deed | $38,000 | First American Title Insuran |
| Date | Status | Loan Amount | Loan Type |
|---|---|---|---|
| Open | $447,289 | VA | |
| Previous Owner | $200,000 | Purchase Money Mortgage | |
| Previous Owner | $215,785 | VA | |
| Previous Owner | $170,000 | Construction |
| Date | Event | Price | List to Sale | Price per Sq Ft |
|---|---|---|---|---|
| 11/20/2025 11/20/25 | Sold | $433,000 | +0.7% | $130 / Sq Ft |
| 10/13/2025 10/13/25 | Pending | -- | -- | -- |
| 10/10/2025 10/10/25 | For Sale | $429,900 | -- | $129 / Sq Ft |
| Year | Tax Paid | Tax Assessment Tax Assessment Total Assessment is a certain percentage of the fair market value that is determined by local assessors to be the total taxable value of land and additions on the property. | Land | Improvement |
|---|---|---|---|---|
| 2024 | -- | $104,661 | $16,694 | $87,967 |
| 2023 | -- | $92,892 | $14,817 | $78,075 |
| 2022 | $0 | $85,402 | $13,622 | $71,780 |
| 2021 | $0 | $81,420 | $13,666 | $67,754 |
| 2020 | $0 | $77,071 | $12,936 | $64,135 |
| 2019 | $0 | $77,071 | $12,936 | $64,135 |
| 2018 | $0 | $74,833 | $12,560 | $62,273 |
| 2017 | $0 | $77,198 | $14,705 | $62,493 |
| 2016 | $0 | $75,396 | $14,362 | $61,034 |
| 2014 | $5,156 | $74,524 | $14,196 | $60,328 |
| 2013 | $5,525 | $76,111 | $13,979 | $62,132 |
Seller's Agent in 2025
Lindy Kurtz
Genstone Realty
(210) 633-7679
58 in this area
244 Total Sales
Buyer's Agent in 2025
Brent Ludwig
Genstone Realty
(618) 779-4509
1 in this area
63 Total Sales
Source: MARIS MLS
MLS Number: MIS25068510
APN: 04-19.0-113-014
Disclaimer: Certain information contained herein is derived from information provided by parties other than Homes.com. All information provided is deemed reliable, but is not guaranteed to be accurate and should be independently verified.
![]() Based on information submitted to the MLS GRID. All data is obtained from various sources and may not have been verified by broker or MLS GRID. Supplied Open House Information is subject to change without notice. All information should be independently reviewed and verified for accuracy. Properties may or may not be listed by the office/agent presenting the information. Some IDX listings have been excluded from this website.
Based on information submitted to the MLS GRID. All data is obtained from various sources and may not have been verified by broker or MLS GRID. Supplied Open House Information is subject to change without notice. All information should be independently reviewed and verified for accuracy. Properties may or may not be listed by the office/agent presenting the information. Some IDX listings have been excluded from this website.
Based on information submitted to the MLS GRID
Ask me questions while you tour the home.