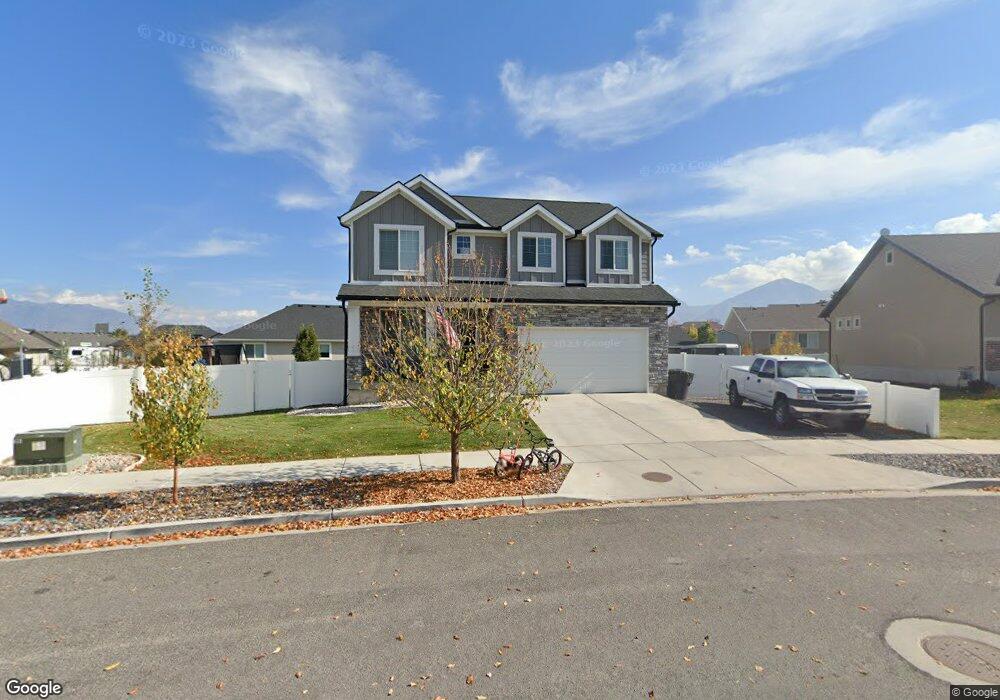
536 N 200 W Unit 3 Payson, UT 84651
Estimated Value: $470,000 - $617,000
3
Beds
3
Baths
2,213
Sq Ft
$251/Sq Ft
Est. Value
About This Home
This home is located at 536 N 200 W Unit 3, Payson, UT 84651 and is currently estimated at $555,519, approximately $251 per square foot. 536 N 200 W Unit 3 is a home located in Utah County with nearby schools including Taylor Elementary School, Mt. Nebo Junior High School, and Salem Junior High School.
Ownership History
Date
Name
Owned For
Owner Type
Purchase Details
Closed on
Feb 7, 2018
Sold by
Despain Darrick and Wanczyk Treasure
Bought by
Vazquez Ramirez Adrian and Schukencht Gabrielle
Current Estimated Value
Home Financials for this Owner
Home Financials are based on the most recent Mortgage that was taken out on this home.
Original Mortgage
$345,805
Outstanding Balance
$292,866
Interest Rate
3.99%
Mortgage Type
New Conventional
Estimated Equity
$262,653
Purchase Details
Closed on
Feb 28, 2017
Sold by
R & C Llc
Bought by
Despain Darrick and Wanczyk Treasure
Create a Home Valuation Report for This Property
The Home Valuation Report is an in-depth analysis detailing your home's value as well as a comparison with similar homes in the area
Home Values in the Area
Average Home Value in this Area
Purchase History
| Date | Buyer | Sale Price | Title Company |
|---|---|---|---|
| Vazquez Ramirez Adrian | -- | First American Title | |
| Despain Darrick | -- | Pro Title And Escrow Inc |
Source: Public Records
Mortgage History
| Date | Status | Borrower | Loan Amount |
|---|---|---|---|
| Open | Vazquez Ramirez Adrian | $345,805 |
Source: Public Records
Tax History Compared to Growth
Tax History
| Year | Tax Paid | Tax Assessment Tax Assessment Total Assessment is a certain percentage of the fair market value that is determined by local assessors to be the total taxable value of land and additions on the property. | Land | Improvement |
|---|---|---|---|---|
| 2025 | $2,637 | $286,715 | $174,600 | $346,700 |
| 2024 | $2,637 | $268,400 | $0 | $0 |
| 2023 | $2,706 | $276,155 | $0 | $0 |
| 2022 | $2,663 | $267,300 | $0 | $0 |
| 2021 | $2,196 | $353,600 | $107,000 | $246,600 |
| 2020 | $2,057 | $323,900 | $93,000 | $230,900 |
| 2019 | $1,937 | $312,700 | $88,100 | $224,600 |
| 2018 | $1,843 | $286,800 | $77,500 | $209,300 |
| 2017 | $657 | $55,000 | $0 | $0 |
Source: Public Records
Map
Nearby Homes