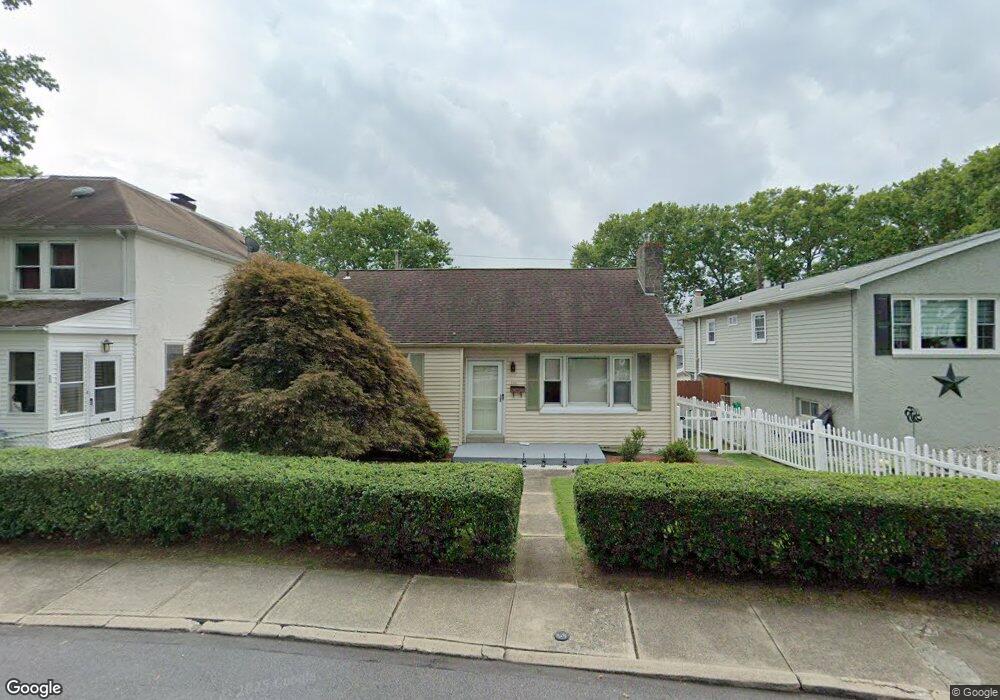
536 North Cir Bethlehem, PA 18018
Downtown Bethlehem NeighborhoodEstimated Value: $225,321 - $303,000
3
Beds
1
Bath
925
Sq Ft
$276/Sq Ft
Est. Value
About This Home
This home is located at 536 North Cir, Bethlehem, PA 18018 and is currently estimated at $255,330, approximately $276 per square foot. 536 North Cir is a home located in Northampton County with nearby schools including Thomas Jefferson Elementary School, Northeast Middle School, and Liberty High School.
Ownership History
Date
Name
Owned For
Owner Type
Purchase Details
Closed on
Jun 16, 2009
Sold by
Stauffer Betty G and Stauffer Robert E
Bought by
Mertz Ryan A
Current Estimated Value
Home Financials for this Owner
Home Financials are based on the most recent Mortgage that was taken out on this home.
Original Mortgage
$135,327
Outstanding Balance
$86,191
Interest Rate
4.92%
Mortgage Type
FHA
Estimated Equity
$169,139
Purchase Details
Closed on
Dec 30, 1999
Bought by
Stauffer Betty G
Create a Home Valuation Report for This Property
The Home Valuation Report is an in-depth analysis detailing your home's value as well as a comparison with similar homes in the area
Home Values in the Area
Average Home Value in this Area
Purchase History
| Date | Buyer | Sale Price | Title Company |
|---|---|---|---|
| Mertz Ryan A | $143,000 | None Available | |
| Stauffer Betty G | -- | -- |
Source: Public Records
Mortgage History
| Date | Status | Borrower | Loan Amount |
|---|---|---|---|
| Open | Mertz Ryan A | $135,327 |
Source: Public Records
Tax History
| Year | Tax Paid | Tax Assessment Tax Assessment Total Assessment is a certain percentage of the fair market value that is determined by local assessors to be the total taxable value of land and additions on the property. | Land | Improvement |
|---|---|---|---|---|
| 2025 | $411 | $38,100 | $12,300 | $25,800 |
| 2024 | $3,368 | $38,100 | $12,300 | $25,800 |
| 2023 | $3,368 | $38,100 | $12,300 | $25,800 |
| 2022 | $3,341 | $38,100 | $12,300 | $25,800 |
| 2021 | $3,319 | $38,100 | $12,300 | $25,800 |
| 2020 | $3,287 | $38,100 | $12,300 | $25,800 |
| 2019 | $3,276 | $38,100 | $12,300 | $25,800 |
| 2018 | $3,197 | $38,100 | $12,300 | $25,800 |
| 2017 | $3,158 | $38,100 | $12,300 | $25,800 |
| 2016 | -- | $38,100 | $12,300 | $25,800 |
| 2015 | -- | $38,100 | $12,300 | $25,800 |
| 2014 | -- | $38,100 | $12,300 | $25,800 |
Source: Public Records
Map
Nearby Homes
Your Personal Tour Guide
Ask me questions while you tour the home.