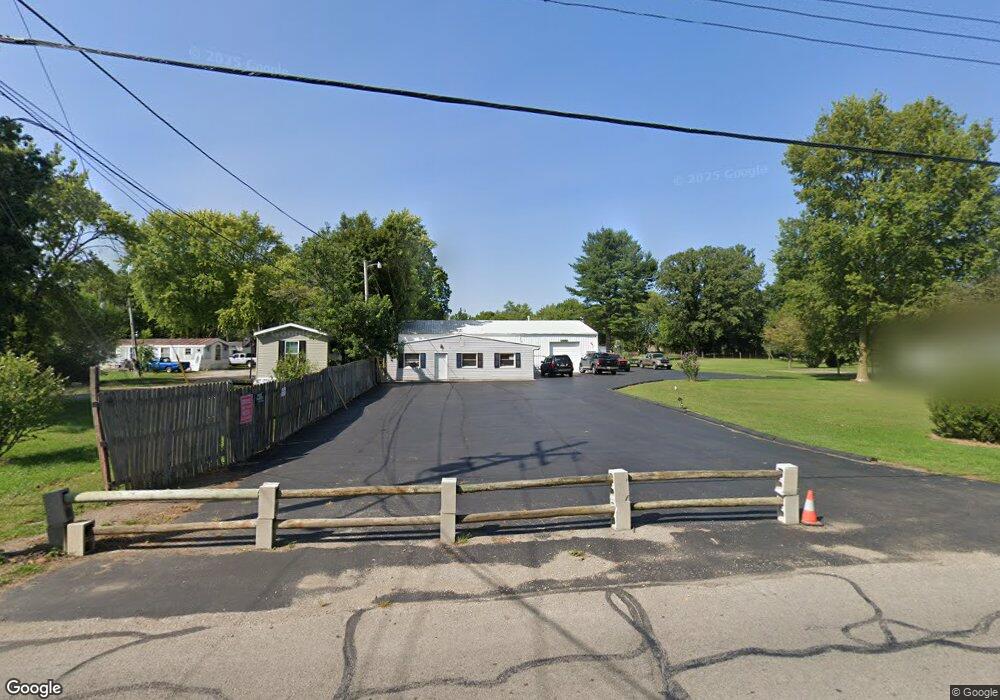
536 NW L St Richmond, IN 47374
Estimated Value: $110,000 - $151,958
2
Beds
2
Baths
2,040
Sq Ft
$63/Sq Ft
Est. Value
About This Home
This home is located at 536 NW L St, Richmond, IN 47374 and is currently estimated at $128,490, approximately $62 per square foot. 536 NW L St is a home located in Wayne County with nearby schools including Fairview Elementary School, Dennis Middle School, and Richmond High School.
Ownership History
Date
Name
Owned For
Owner Type
Purchase Details
Closed on
Apr 15, 2015
Sold by
Vanduyn Roger D
Bought by
Wise William S
Current Estimated Value
Purchase Details
Closed on
Oct 31, 2005
Sold by
Mac Del Inc
Bought by
Vanduyn Roger D
Home Financials for this Owner
Home Financials are based on the most recent Mortgage that was taken out on this home.
Original Mortgage
$85,500
Interest Rate
5.8%
Mortgage Type
New Conventional
Create a Home Valuation Report for This Property
The Home Valuation Report is an in-depth analysis detailing your home's value as well as a comparison with similar homes in the area
Home Values in the Area
Average Home Value in this Area
Purchase History
| Date | Buyer | Sale Price | Title Company |
|---|---|---|---|
| Wise William S | $105,000 | -- | |
| Vanduyn Roger D | -- | -- |
Source: Public Records
Mortgage History
| Date | Status | Borrower | Loan Amount |
|---|---|---|---|
| Previous Owner | Vanduyn Roger D | $85,500 |
Source: Public Records
Tax History Compared to Growth
Tax History
| Year | Tax Paid | Tax Assessment Tax Assessment Total Assessment is a certain percentage of the fair market value that is determined by local assessors to be the total taxable value of land and additions on the property. | Land | Improvement |
|---|---|---|---|---|
| 2024 | $694 | $69,400 | $12,400 | $57,000 |
| 2023 | $610 | $61,000 | $10,900 | $50,100 |
| 2022 | $649 | $64,900 | $10,900 | $54,000 |
| 2021 | $580 | $58,000 | $10,900 | $47,100 |
| 2020 | $1,132 | $56,600 | $10,900 | $45,700 |
| 2019 | $409 | $41,400 | $10,900 | $30,500 |
| 2018 | $397 | $41,400 | $10,900 | $30,500 |
| 2017 | $641 | $43,100 | $10,900 | $32,200 |
| 2016 | $820 | $62,200 | $2,700 | $59,500 |
| 2014 | $686 | $63,600 | $2,700 | $60,900 |
| 2013 | $686 | $61,500 | $2,700 | $58,800 |
Source: Public Records
Map
Nearby Homes