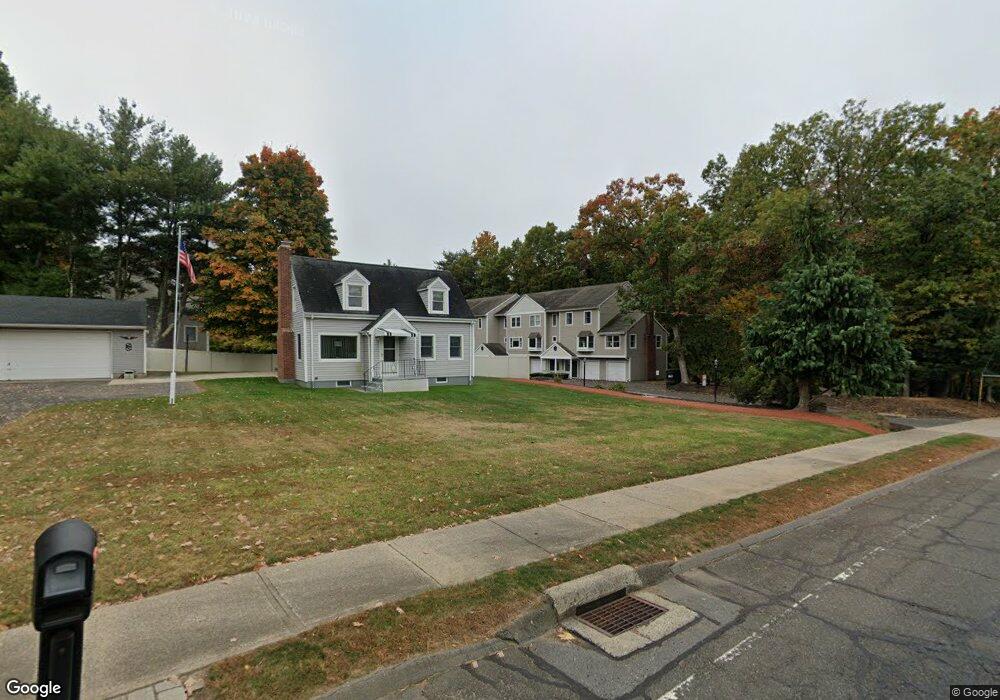
536 Redstone Hill Rd Unit 3 Bristol, CT 06010
Forestville NeighborhoodEstimated Value: $295,000 - $316,000
2
Beds
3
Baths
1,320
Sq Ft
$230/Sq Ft
Est. Value
About This Home
This home is located at 536 Redstone Hill Rd Unit 3, Bristol, CT 06010 and is currently estimated at $303,796, approximately $230 per square foot. 536 Redstone Hill Rd Unit 3 is a home located in Hartford County with nearby schools including Bristol Central High School, St Matthew School, and Central Christian Academy.
Ownership History
Date
Name
Owned For
Owner Type
Purchase Details
Closed on
Aug 30, 2004
Sold by
Bausher Mark A and Bausher Cheryl A
Bought by
Nicholas Lois C
Current Estimated Value
Purchase Details
Closed on
Aug 16, 2002
Sold by
Bonczek David M and Bonczek Lynn
Bought by
Bausher Mark A
Home Financials for this Owner
Home Financials are based on the most recent Mortgage that was taken out on this home.
Original Mortgage
$134,900
Interest Rate
6.61%
Purchase Details
Closed on
Jul 19, 1988
Sold by
Pryor James J
Bought by
Bonczek David M
Home Financials for this Owner
Home Financials are based on the most recent Mortgage that was taken out on this home.
Original Mortgage
$104,900
Interest Rate
10.57%
Purchase Details
Closed on
Apr 19, 1988
Sold by
Pryor James J
Bought by
Perron Scott D
Home Financials for this Owner
Home Financials are based on the most recent Mortgage that was taken out on this home.
Original Mortgage
$100,000
Interest Rate
9.78%
Create a Home Valuation Report for This Property
The Home Valuation Report is an in-depth analysis detailing your home's value as well as a comparison with similar homes in the area
Home Values in the Area
Average Home Value in this Area
Purchase History
| Date | Buyer | Sale Price | Title Company |
|---|---|---|---|
| Nicholas Lois C | $165,000 | -- | |
| Bausher Mark A | $142,000 | -- | |
| Bonczek David M | $145,000 | -- | |
| Perron Scott D | $135,000 | -- |
Source: Public Records
Mortgage History
| Date | Status | Borrower | Loan Amount |
|---|---|---|---|
| Previous Owner | Perron Scott D | $134,900 | |
| Previous Owner | Perron Scott D | $15,000 | |
| Previous Owner | Perron Scott D | $104,900 | |
| Previous Owner | Perron Scott D | $100,000 |
Source: Public Records
Tax History Compared to Growth
Tax History
| Year | Tax Paid | Tax Assessment Tax Assessment Total Assessment is a certain percentage of the fair market value that is determined by local assessors to be the total taxable value of land and additions on the property. | Land | Improvement |
|---|---|---|---|---|
| 2025 | $4,690 | $138,950 | $0 | $138,950 |
| 2024 | $4,426 | $138,950 | $0 | $138,950 |
| 2023 | $4,217 | $138,950 | $0 | $138,950 |
| 2022 | $3,962 | $103,320 | $0 | $103,320 |
| 2021 | $3,962 | $103,320 | $0 | $103,320 |
| 2020 | $3,962 | $103,320 | $0 | $103,320 |
| 2019 | $3,931 | $103,320 | $0 | $103,320 |
| 2018 | $3,810 | $103,320 | $0 | $103,320 |
| 2017 | $4,119 | $114,310 | $0 | $114,310 |
| 2016 | $4,119 | $114,310 | $0 | $114,310 |
| 2015 | $3,956 | $114,310 | $0 | $114,310 |
| 2014 | $3,956 | $114,310 | $0 | $114,310 |
Source: Public Records
Map
Nearby Homes
- 2 Charlies Way
- 15 Charlies Way
- 429 Redstone Hill Rd
- 568 Village St
- 84 Dino Rd
- 25 Zack Ln
- 603 Village St
- 575 Village St
- 581 Village St
- 595 Village St
- 279 Redstone Hill Rd Unit 75
- 519 Village St
- 26 Skyline Dr
- 189 Redstone Hill Rd Unit 7
- 430 Emmett St Unit L
- 426 Emmett St Unit N
- 426 Emmett St Unit L
- 424 Emmett St Unit K
- 132 Hollyberry Ln
- 143 Redstone St
- 536 Redstone Hill Rd Unit 24
- 536 Redstone Hill Rd Unit 23
- 536 Redstone Hill Rd Unit 22
- 536 Redstone Hill Rd Unit 21
- 536 Redstone Hill Rd Unit 20
- 536 Redstone Hill Rd Unit 19
- 536 Redstone Hill Rd Unit 17
- 536 Redstone Hill Rd Unit 16
- 536 Redstone Hill Rd Unit 15
- 536 Redstone Hill Rd Unit 14
- 536 Redstone Hill Rd Unit 12
- 536 Redstone Hill Rd Unit 11
- 536 Redstone Hill Rd Unit 6
- 536 Redstone Hill Rd Unit 7
- 536 Redstone Hill Rd Unit 8
- 536 Redstone Hill Rd Unit 9
- 536 Redstone Hill Rd Unit 10
- 536 Redstone Hill Rd Unit 1
- 536 Redstone Hill Rd Unit 4