Estimated Value: $571,459 - $657,000
4
Beds
7
Baths
2,051
Sq Ft
$298/Sq Ft
Est. Value
About This Home
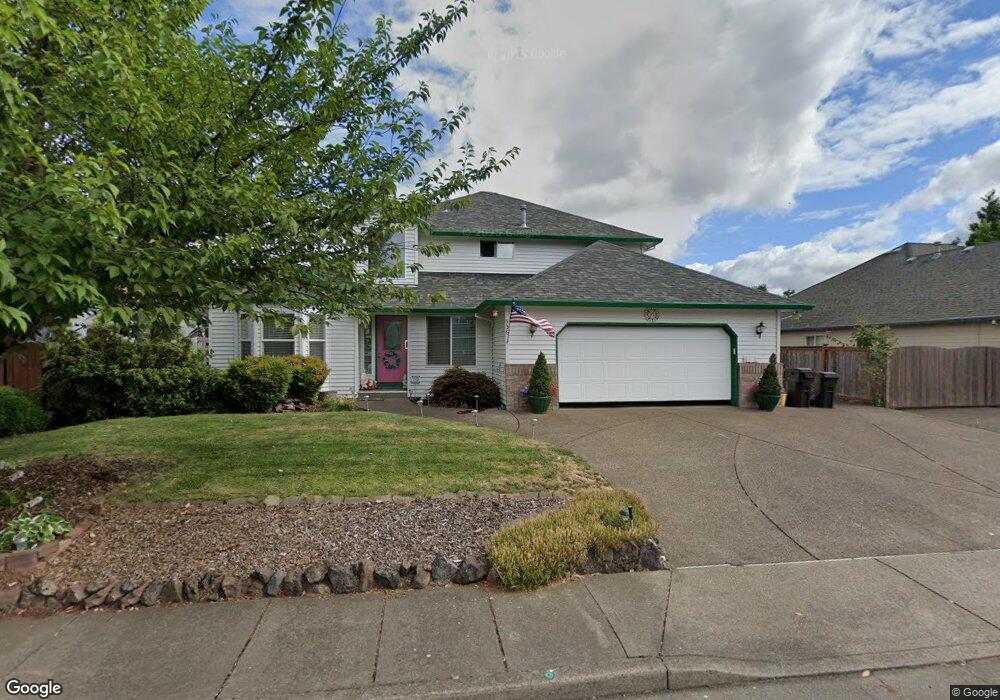
This home is located at 536 SE 10th Ave, Canby, OR 97013 and is currently estimated at $611,615, approximately $298 per square foot. 536 SE 10th Ave is a home located in Clackamas County with nearby schools including Josefa L. Sambrano Elementary School, Philander Lee Elementary School, and Baker Prairie Middle School.
Ownership History
Date
Name
Owned For
Owner Type
Purchase Details
Closed on
Jun 18, 2002
Sold by
Pavlicek Brent J and Pavlicek Elynor G
Bought by
Pavlicek Sylvester and Pavlicek Edith
Current Estimated Value
Purchase Details
Closed on
Feb 23, 1998
Sold by
Vannguyen Duc and Say Nguyen
Bought by
Pavlicek Brent J and Pavlicek Elynor G
Home Financials for this Owner
Home Financials are based on the most recent Mortgage that was taken out on this home.
Original Mortgage
$128,000
Outstanding Balance
$21,745
Interest Rate
6.9%
Estimated Equity
$589,870
Purchase Details
Closed on
Apr 7, 1997
Sold by
Vanvannguyen Duc Van and Nguyen Gon
Bought by
Vanvannguyen Duc Van and Nguyen Gon
Purchase Details
Closed on
Aug 22, 1995
Sold by
K A Kraxberger Builder Inc
Bought by
Vanvannguyen Duc Van and Nguyen Gon
Home Financials for this Owner
Home Financials are based on the most recent Mortgage that was taken out on this home.
Original Mortgage
$100,000
Interest Rate
7.5%
Purchase Details
Closed on
Feb 13, 1995
Sold by
Regan Enterprises
Bought by
K A Kraxberger Builders Inc
Create a Home Valuation Report for This Property
The Home Valuation Report is an in-depth analysis detailing your home's value as well as a comparison with similar homes in the area
Home Values in the Area
Average Home Value in this Area
Purchase History
| Date | Buyer | Sale Price | Title Company |
|---|---|---|---|
| Pavlicek Sylvester | $215,000 | First American | |
| Pavlicek Brent J | $190,000 | Pacific Nw Title | |
| Vanvannguyen Duc Van | $169,000 | -- | |
| Vanvannguyen Duc Van | $169,000 | Stewart Title | |
| K A Kraxberger Builders Inc | $30,723 | Chicago Title Insurance Co |
Source: Public Records
Mortgage History
| Date | Status | Borrower | Loan Amount |
|---|---|---|---|
| Open | Pavlicek Brent J | $128,000 | |
| Previous Owner | Vanvannguyen Duc Van | $100,000 |
Source: Public Records
Tax History Compared to Growth
Tax History
| Year | Tax Paid | Tax Assessment Tax Assessment Total Assessment is a certain percentage of the fair market value that is determined by local assessors to be the total taxable value of land and additions on the property. | Land | Improvement |
|---|---|---|---|---|
| 2025 | $5,890 | $332,434 | -- | -- |
| 2024 | $5,725 | $322,752 | -- | -- |
| 2023 | $5,725 | $313,352 | $0 | $0 |
| 2022 | $5,265 | $304,226 | $0 | $0 |
| 2021 | $5,070 | $295,366 | $0 | $0 |
| 2020 | $4,980 | $286,764 | $0 | $0 |
| 2019 | $4,742 | $278,412 | $0 | $0 |
| 2018 | $4,636 | $270,303 | $0 | $0 |
| 2017 | $4,519 | $262,430 | $0 | $0 |
| 2016 | $4,368 | $254,786 | $0 | $0 |
| 2015 | $4,218 | $247,365 | $0 | $0 |
| 2014 | $4,096 | $240,160 | $0 | $0 |
Source: Public Records
Map
Nearby Homes
- 423 SE 7th Ave
- 331 SE 9th Ave
- 387 SE 7th Ave
- 1460 SE 9th Ave
- 363 SE 7th Ave
- 575 S Ponderosa St
- 582 S Maple St
- 385 SE Township Rd
- 550 SE 5th Ave
- 1409 S Maple St
- 1143 SE 17th Ave
- 1357 SE 17th Ave
- 201 SE 16th Ave
- 486 S Knott St
- 1333 SE 14th Ave
- 248 SE Township Rd
- 574 S Ivy St
- 1111 SE 3rd Ave Unit 74
- 1827 S Pepperwood St
- 1821 S Pepperwood St
- 498 SE 10th Ave
- 556 SE 10th Ave
- 563 SE 9th Ave
- 581 SE 9th Ave
- 480 SE 10th Ave
- 505 SE 10th Ave
- 527 SE 9th Ave
- 487 SE 10th Ave Unit 1
- 487 SE 10th Ave
- 551 SE 10th Ave
- 462 SE 10th Ave
- 501 SE 9th Ave Unit 1
- 501 SE 9th Ave
- 986 S Pine St
- 964 S Pine St
- 1025 S Pine St
- 574 SE 9th Ave
- 596 SE 9th Ave
- 443 SE 10th Ave
- 1229 SE 10th Ave