Estimated Value: $286,458 - $306,000
2
Beds
3
Baths
1,491
Sq Ft
$199/Sq Ft
Est. Value
About This Home
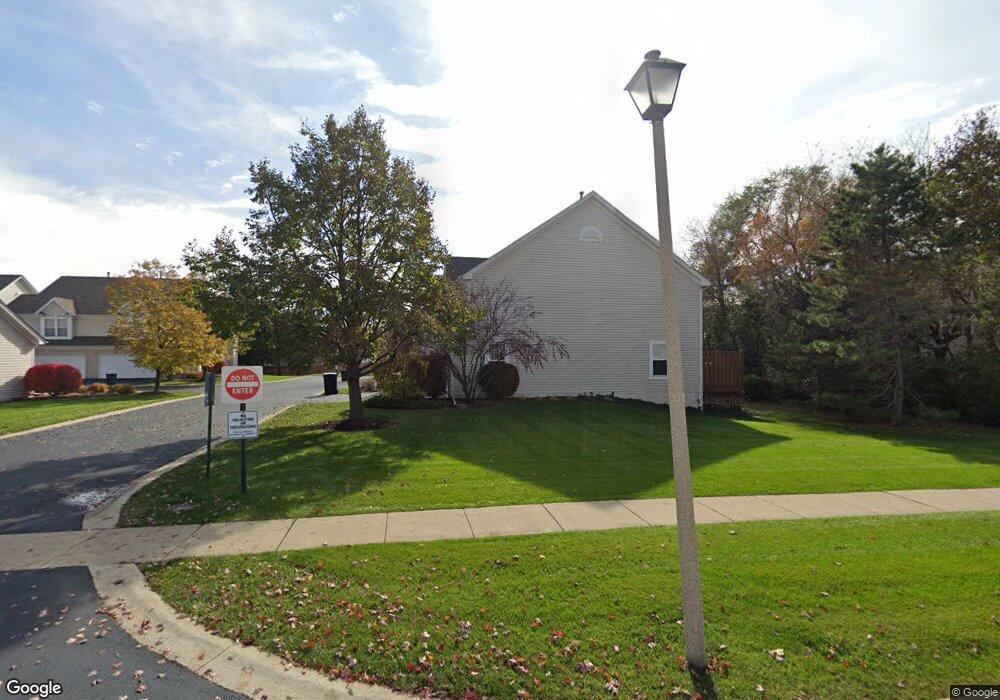
This home is located at 536 W Danbury Dr Unit 11D, Cary, IL 60013 and is currently estimated at $296,865, approximately $199 per square foot. 536 W Danbury Dr Unit 11D is a home located in McHenry County with nearby schools including Canterbury Elementary School, Hannah Beardsley Middle School, and Prairie Ridge High School.
Ownership History
Date
Name
Owned For
Owner Type
Purchase Details
Closed on
Sep 27, 2010
Sold by
Benthusen James A and Benthusen Jesica
Bought by
Brune Thomas B
Current Estimated Value
Home Financials for this Owner
Home Financials are based on the most recent Mortgage that was taken out on this home.
Original Mortgage
$113,400
Outstanding Balance
$70,538
Interest Rate
3.25%
Mortgage Type
VA
Estimated Equity
$226,327
Purchase Details
Closed on
Nov 9, 2006
Sold by
Benthusen James A
Bought by
Benthusen James A and March Jesica
Purchase Details
Closed on
Jul 29, 2005
Sold by
Synek Matthew S and Synek Lisa K
Bought by
Benthusen James A
Home Financials for this Owner
Home Financials are based on the most recent Mortgage that was taken out on this home.
Original Mortgage
$39,000
Interest Rate
5.66%
Mortgage Type
Stand Alone Second
Purchase Details
Closed on
Jun 29, 1998
Sold by
Home State Bank/National Assn
Bought by
Synek Matthew S and Gee Lisa K
Home Financials for this Owner
Home Financials are based on the most recent Mortgage that was taken out on this home.
Original Mortgage
$144,000
Interest Rate
7.03%
Create a Home Valuation Report for This Property
The Home Valuation Report is an in-depth analysis detailing your home's value as well as a comparison with similar homes in the area
Home Values in the Area
Average Home Value in this Area
Purchase History
| Date | Buyer | Sale Price | Title Company |
|---|---|---|---|
| Brune Thomas B | $140,000 | First United Title Svcs Inc | |
| Benthusen James A | -- | None Available | |
| Benthusen James A | $195,000 | Pntn | |
| Synek Matthew S | $149,000 | -- |
Source: Public Records
Mortgage History
| Date | Status | Borrower | Loan Amount |
|---|---|---|---|
| Open | Brune Thomas B | $113,400 | |
| Previous Owner | Benthusen James A | $39,000 | |
| Previous Owner | Synek Matthew S | $144,000 |
Source: Public Records
Tax History Compared to Growth
Tax History
| Year | Tax Paid | Tax Assessment Tax Assessment Total Assessment is a certain percentage of the fair market value that is determined by local assessors to be the total taxable value of land and additions on the property. | Land | Improvement |
|---|---|---|---|---|
| 2024 | $4,860 | $72,098 | $14,911 | $57,187 |
| 2023 | $4,109 | $64,483 | $13,336 | $51,147 |
| 2022 | $4,855 | $66,055 | $12,036 | $54,019 |
| 2021 | $1,992 | $61,538 | $11,213 | $50,325 |
| 2020 | $2,023 | $59,359 | $10,816 | $48,543 |
| 2019 | $2,059 | $53,104 | $10,352 | $42,752 |
| 2018 | $2,109 | $49,248 | $9,563 | $39,685 |
| 2017 | $2,230 | $46,395 | $9,009 | $37,386 |
| 2016 | $2,343 | $43,515 | $8,450 | $35,065 |
| 2013 | -- | $32,830 | $7,883 | $24,947 |
Source: Public Records
Map
Nearby Homes
- 1309 New Haven Dr
- 1108 E Danbury Dr Unit 4D
- 3712 3 Oaks Rd
- 442 New Haven Dr
- 265 Forestview Dr
- 888 Blazing Star Trail
- 0 Kaper Dr
- 923 Crookedstick Ct
- 1424 New Haven Dr
- 1436 New Haven Dr
- 763 Blazing Star Trail
- 903 Crookedstick Ct
- 12 Jefferson Ln
- 822 Oakbrook Dr
- 780 Merrimac St
- 602 Hillcrest Ln
- 800 Oakbrook Dr
- 368 Copper Canyon Trail
- 1173 Amber Dr
- 20 Oak Valley Dr Unit 2
- 528 W Danbury Dr Unit 11C
- 544 W Danbury Dr Unit 11E
- 512 W Danbury Dr
- 1291 W Danbury Dr Unit 10F
- 1301 New Haven Dr
- 1305 New Haven Dr
- 1307 New Haven Dr
- 1311 New Haven Dr
- 1303 New Haven Dr
- 1274 W Danbury Dr Unit 9B
- 1282 W Danbury Dr Unit 9A
- 1266 W Danbury Dr Unit 9C
- 1258 W Danbury Dr
- 1283 W Danbury Dr Unit 10E
- 1259 W Danbury Dr Unit 10B
- 1275 W Danbury Dr Unit 10D
- 1251 W Danbury Dr Unit 10A
- 1267 W Danbury Dr
- 1270 Chickory Ridge Trail
- 1266 Chickory Ridge Trail