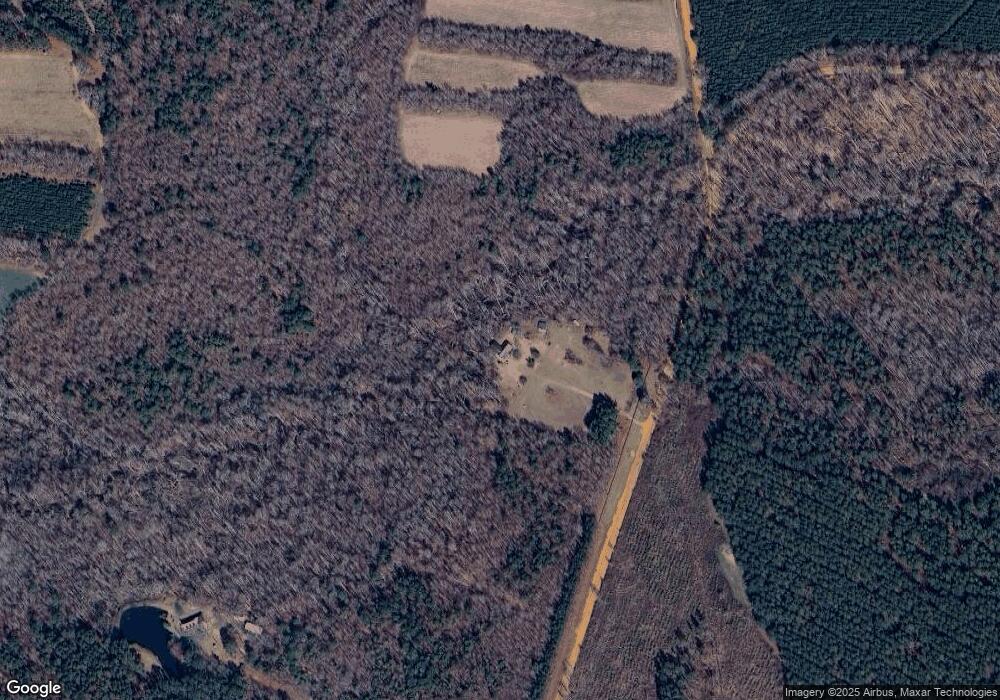
536 Wyatt Place Rd Waynesboro, GA 30830
Estimated Value: $272,000 - $307,678
3
Beds
1
Bath
1,872
Sq Ft
$155/Sq Ft
Est. Value
About This Home
This home is located at 536 Wyatt Place Rd, Waynesboro, GA 30830 and is currently estimated at $289,893, approximately $154 per square foot. 536 Wyatt Place Rd is a home located in Burke County with nearby schools including Burke County High School.
Ownership History
Date
Name
Owned For
Owner Type
Purchase Details
Closed on
Sep 7, 2012
Sold by
Holland I Joshua
Bought by
Holland I Joshua and Holland Alana G
Current Estimated Value
Purchase Details
Closed on
Jun 11, 2003
Sold by
Bradley Michael Wrig
Bought by
Holland Joshua L
Purchase Details
Closed on
Dec 14, 1999
Sold by
Murphy Kenneth
Bought by
Bradley Michael Wrig
Purchase Details
Closed on
May 8, 1995
Sold by
Brashear G T
Bought by
Murphy Kenneth
Purchase Details
Closed on
Feb 22, 1995
Sold by
Brashear Dev Corp
Bought by
Brashear G T
Purchase Details
Closed on
Feb 8, 1995
Bought by
Brashear Dev Corp
Create a Home Valuation Report for This Property
The Home Valuation Report is an in-depth analysis detailing your home's value as well as a comparison with similar homes in the area
Home Values in the Area
Average Home Value in this Area
Purchase History
| Date | Buyer | Sale Price | Title Company |
|---|---|---|---|
| Holland I Joshua | $83,500 | -- | |
| Holland Joshua L | $83,500 | -- | |
| Bradley Michael Wrig | $74,000 | -- | |
| Murphy Kenneth | $14,300 | -- | |
| Brashear G T | $60,500 | -- | |
| Brashear Dev Corp | $60,500 | -- |
Source: Public Records
Tax History Compared to Growth
Tax History
| Year | Tax Paid | Tax Assessment Tax Assessment Total Assessment is a certain percentage of the fair market value that is determined by local assessors to be the total taxable value of land and additions on the property. | Land | Improvement |
|---|---|---|---|---|
| 2024 | $1,766 | $92,538 | $13,741 | $78,797 |
| 2023 | $1,874 | $89,734 | $12,842 | $76,892 |
| 2022 | $1,580 | $75,954 | $12,116 | $63,838 |
| 2021 | $1,380 | $65,067 | $12,116 | $52,951 |
| 2020 | $1,382 | $65,067 | $12,116 | $52,951 |
| 2019 | $1,273 | $59,121 | $12,116 | $47,005 |
| 2018 | $1,273 | $59,121 | $12,116 | $47,005 |
| 2017 | $1,302 | $60,210 | $11,143 | $49,067 |
| 2016 | $1,311 | $60,210 | $11,143 | $49,067 |
| 2015 | $1,315 | $59,917 | $11,143 | $48,774 |
| 2014 | $1,108 | $59,917 | $11,143 | $48,774 |
| 2013 | -- | $59,917 | $11,143 | $48,774 |
Source: Public Records
Map
Nearby Homes