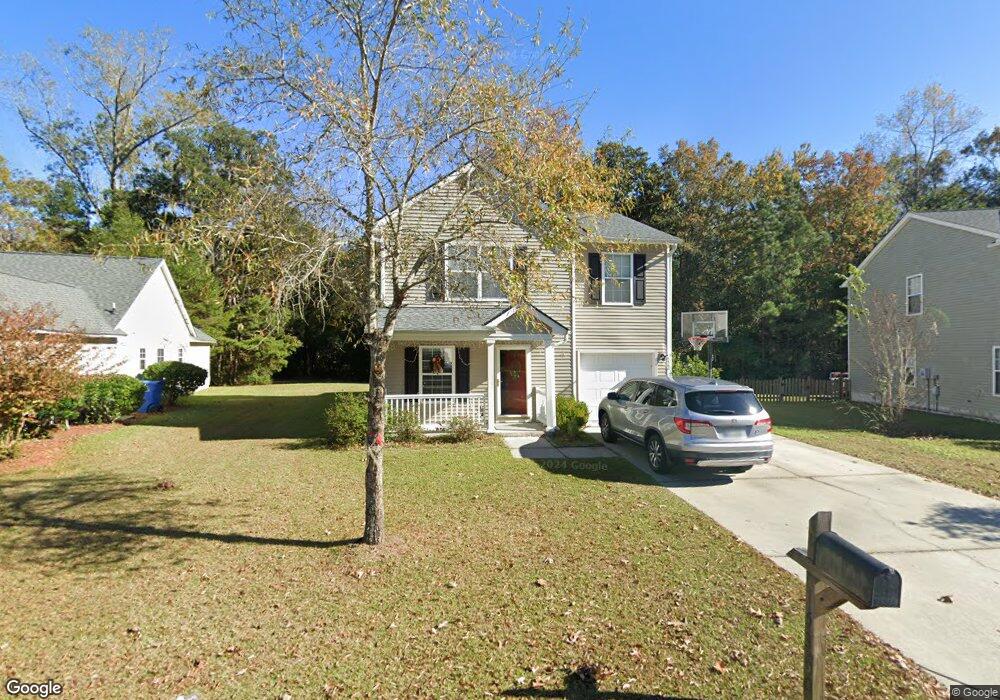
5360 Copley Cir Summerville, SC 29485
Estimated Value: $328,000 - $351,469
3
Beds
3
Baths
1,753
Sq Ft
$195/Sq Ft
Est. Value
About This Home
This home is located at 5360 Copley Cir, Summerville, SC 29485 and is currently estimated at $341,117, approximately $194 per square foot. 5360 Copley Cir is a home located in Dorchester County with nearby schools including Fort Dorchester Elementary School, Oakbrook Middle School, and Fort Dorchester High School.
Ownership History
Date
Name
Owned For
Owner Type
Purchase Details
Closed on
Nov 20, 2009
Sold by
Bentley David G and Bentley Pamela
Bought by
Ladd Philip A and Ladd Amy J
Current Estimated Value
Home Financials for this Owner
Home Financials are based on the most recent Mortgage that was taken out on this home.
Original Mortgage
$162,993
Outstanding Balance
$106,101
Interest Rate
4.94%
Mortgage Type
FHA
Estimated Equity
$235,016
Purchase Details
Closed on
Jun 29, 2007
Sold by
Novotny Michael A and Novotny Crystalynn J
Bought by
Bentley David Griffith and Bentley Pamela
Home Financials for this Owner
Home Financials are based on the most recent Mortgage that was taken out on this home.
Original Mortgage
$164,350
Interest Rate
6.52%
Mortgage Type
Purchase Money Mortgage
Purchase Details
Closed on
Dec 6, 2004
Sold by
Centex Homes
Bought by
Novotny Michael A and Novotny Crystalynn J
Create a Home Valuation Report for This Property
The Home Valuation Report is an in-depth analysis detailing your home's value as well as a comparison with similar homes in the area
Home Values in the Area
Average Home Value in this Area
Purchase History
| Date | Buyer | Sale Price | Title Company |
|---|---|---|---|
| Ladd Philip A | $166,000 | -- | |
| Bentley David Griffith | $173,000 | Attorney | |
| Novotny Michael A | $153,203 | -- |
Source: Public Records
Mortgage History
| Date | Status | Borrower | Loan Amount |
|---|---|---|---|
| Open | Ladd Philip A | $162,993 | |
| Previous Owner | Bentley David Griffith | $164,350 |
Source: Public Records
Tax History Compared to Growth
Tax History
| Year | Tax Paid | Tax Assessment Tax Assessment Total Assessment is a certain percentage of the fair market value that is determined by local assessors to be the total taxable value of land and additions on the property. | Land | Improvement |
|---|---|---|---|---|
| 2024 | $2,058 | $12,282 | $3,800 | $8,482 |
| 2023 | $2,058 | $7,849 | $2,000 | $5,849 |
| 2022 | $1,826 | $6,900 | $1,840 | $5,060 |
| 2021 | $1,826 | $6,900 | $1,840 | $5,060 |
| 2020 | $1,753 | $6,000 | $1,600 | $4,400 |
| 2019 | $1,781 | $6,000 | $1,600 | $4,400 |
| 2018 | $1,536 | $6,000 | $1,600 | $4,400 |
| 2017 | $1,481 | $6,000 | $1,600 | $4,400 |
| 2016 | $1,481 | $6,000 | $1,600 | $4,400 |
| 2015 | $1,478 | $6,000 | $1,600 | $4,400 |
| 2014 | $1,516 | $157,300 | $0 | $0 |
| 2013 | -- | $6,290 | $0 | $0 |
Source: Public Records
Map
Nearby Homes
- 5148 Ballantine Dr
- 9019 Parlor Dr
- 5257 Mulholland Dr
- 5096 Timicuan Way
- 9120 Parlor Dr
- 9118 Parlor Dr
- 104 Tranquil Ln
- 5089 Timicuan Way
- 106 Lamie Dr
- 9313 Sweetbay Ct
- 9028 Parlor Dr
- 5215 Mulholland Dr
- 5212 Mulholland Dr
- 9226 Southern Oak Ln
- 9042 Parlor Dr
- 9210 Southern Oak Ln
- 9204 Southern Oak Ln
- 5261 Stonewall Dr
- 107 Washington Dr
- 9217 Southern Oak Ln
- 5356 Copley Cir
- 5364 Copley Cir
- 5352 Copley Cir
- 5368 Copley Cir
- 5301 Copley Cir
- 5348 Copley Cir
- 5297 Copley Cir
- 5372 Copley Cir
- 5344 Copley Cir
- 5305 Copley Cir
- 5293 Copley Cir
- 5289 Copley Cir
- 5340 Copley Cir
- 5201 Copley Cir
- 5380 Copley Cir
- 5285 Copley Cir
- 9771 Ballantine Dr
- 5336 Copley Cir
- 5205 Copley Cir
- 5281 Copley Cir