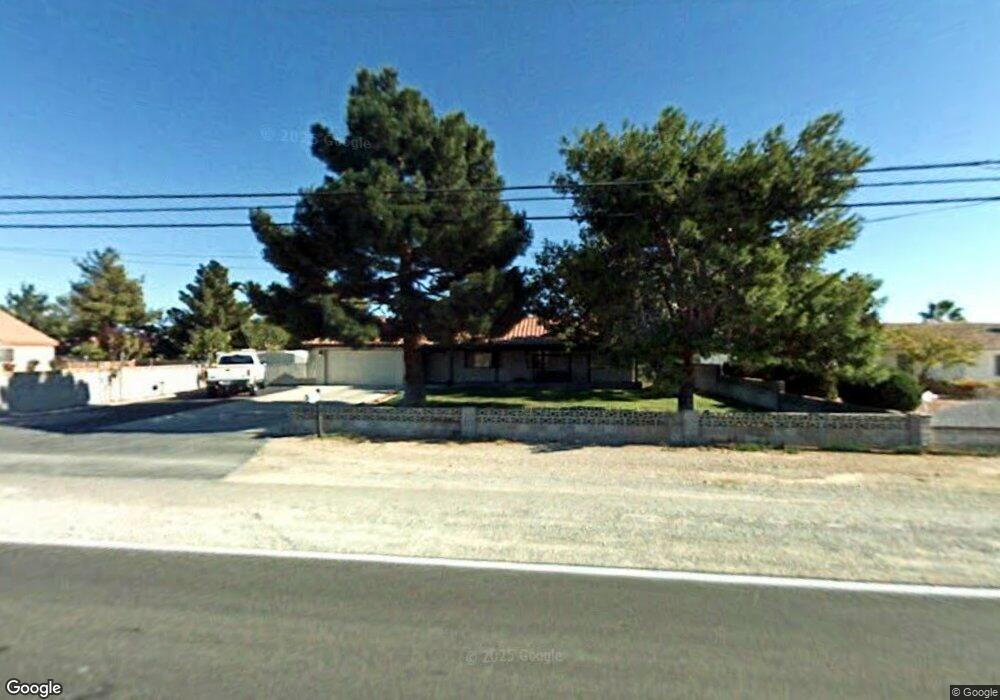
5360 N El Capitan Way Las Vegas, NV 89149
Estimated Value: $841,077 - $994,000
4
Beds
3
Baths
3,075
Sq Ft
$293/Sq Ft
Est. Value
About This Home
This home is located at 5360 N El Capitan Way, Las Vegas, NV 89149 and is currently estimated at $902,019, approximately $293 per square foot. 5360 N El Capitan Way is a home located in Clark County with nearby schools including Dean Lamar Allen Elementary School, Justice Myron E Leavitt Middle School, and Centennial High School.
Ownership History
Date
Name
Owned For
Owner Type
Purchase Details
Closed on
Oct 6, 2015
Sold by
Parry John E and Parry Charrie L
Bought by
Parry Family Trust
Current Estimated Value
Purchase Details
Closed on
Jul 29, 2004
Sold by
Stephenson Wesley E and Stephenson Donna R
Bought by
Parry John E and Parry Charrie L
Home Financials for this Owner
Home Financials are based on the most recent Mortgage that was taken out on this home.
Original Mortgage
$464,000
Outstanding Balance
$164,108
Interest Rate
1.75%
Mortgage Type
Negative Amortization
Estimated Equity
$737,911
Purchase Details
Closed on
Jun 18, 2003
Sold by
Stephenson Wesley E and Stephenson Donna R
Bought by
Stephenson Wesley E and Stephenson Donna R
Home Financials for this Owner
Home Financials are based on the most recent Mortgage that was taken out on this home.
Original Mortgage
$150,000
Interest Rate
5.37%
Mortgage Type
Unknown
Purchase Details
Closed on
Jun 13, 2001
Sold by
Stephenson Wesley E and Stephenson Donna R
Bought by
Stephenson Wesley E and Stephenson Donna R
Create a Home Valuation Report for This Property
The Home Valuation Report is an in-depth analysis detailing your home's value as well as a comparison with similar homes in the area
Home Values in the Area
Average Home Value in this Area
Purchase History
| Date | Buyer | Sale Price | Title Company |
|---|---|---|---|
| Parry Family Trust | -- | None Available | |
| Parry John E | $580,000 | Lawyers Title Of Nevada | |
| Stephenson Wesley E | -- | National Title Company | |
| Stephenson Wesley E | -- | -- |
Source: Public Records
Mortgage History
| Date | Status | Borrower | Loan Amount |
|---|---|---|---|
| Open | Parry John E | $464,000 | |
| Previous Owner | Stephenson Wesley E | $150,000 |
Source: Public Records
Tax History Compared to Growth
Tax History
| Year | Tax Paid | Tax Assessment Tax Assessment Total Assessment is a certain percentage of the fair market value that is determined by local assessors to be the total taxable value of land and additions on the property. | Land | Improvement |
|---|---|---|---|---|
| 2025 | $3,593 | $201,195 | $88,550 | $112,645 |
| 2024 | $3,489 | $201,195 | $88,550 | $112,645 |
| 2023 | $3,489 | $193,715 | $86,625 | $107,090 |
| 2022 | $3,387 | $175,981 | $77,000 | $98,981 |
| 2021 | $3,289 | $155,803 | $61,250 | $94,553 |
| 2020 | $3,190 | $155,611 | $61,250 | $94,361 |
| 2019 | $3,151 | $157,779 | $64,313 | $93,466 |
| 2018 | $3,007 | $154,264 | $63,525 | $90,739 |
| 2017 | $3,624 | $132,906 | $40,250 | $92,656 |
| 2016 | $2,814 | $130,218 | $36,225 | $93,993 |
| 2015 | $2,809 | $112,767 | $20,125 | $92,642 |
| 2014 | $2,727 | $97,042 | $20,125 | $76,917 |
Source: Public Records
Map
Nearby Homes
- 8810 W Stephen Ave
- 8826 W Stephen Ave
- 11127 Rolling Vista Dr
- 8842 W Stephen Ave
- 5215 N Riley St
- 5625 Coe Estates Ct
- 9180 W Hammer Ln
- 8732 Kendall Brook Cir
- 5515 N Campbell Rd
- 3336 Plan at Homestead West
- 3704 Plan at Homestead West
- 0 Dapple Gray Rd
- 5624 N Dapple Gray Rd
- 5745 El Royale Ct
- 5685 N Campbell Rd
- 0 W Rosada Way Unit 2735462
- 5321 N Durango Dr
- 8460 W Ann Rd
- 4925 N Juliano Rd
- 5315 N Fort Apache Rd
- 5340 N El Capitan Way Unit n
- 5340 N El Capitan Way
- 8785 W Hammer Ln
- 8775 W Hammer Ln
- 8765 W Hammer Ln
- 8770 W Fisher Ave
- 8760 W Fisher Ave
- 5345 N El Capitan Way
- 8815 W Hammer Ln
- 8750 W Fisher Ave
- 5315 N El Capitan Way
- 8735 W Hammer Ln
- 8790 W Hammer Ln
- 8835 W Hammer Ln
- 5335 N El Capitan Way
- 8760 W Hammer Ln
- 8725 W Hammer Ln
- 5325 N El Capitan Way
- 8785 W Fisher Ave
- 8740 W Hammer Ln