Estimated Value: $393,000 - $426,000
3
Beds
1
Bath
1,611
Sq Ft
$253/Sq Ft
Est. Value
About This Home
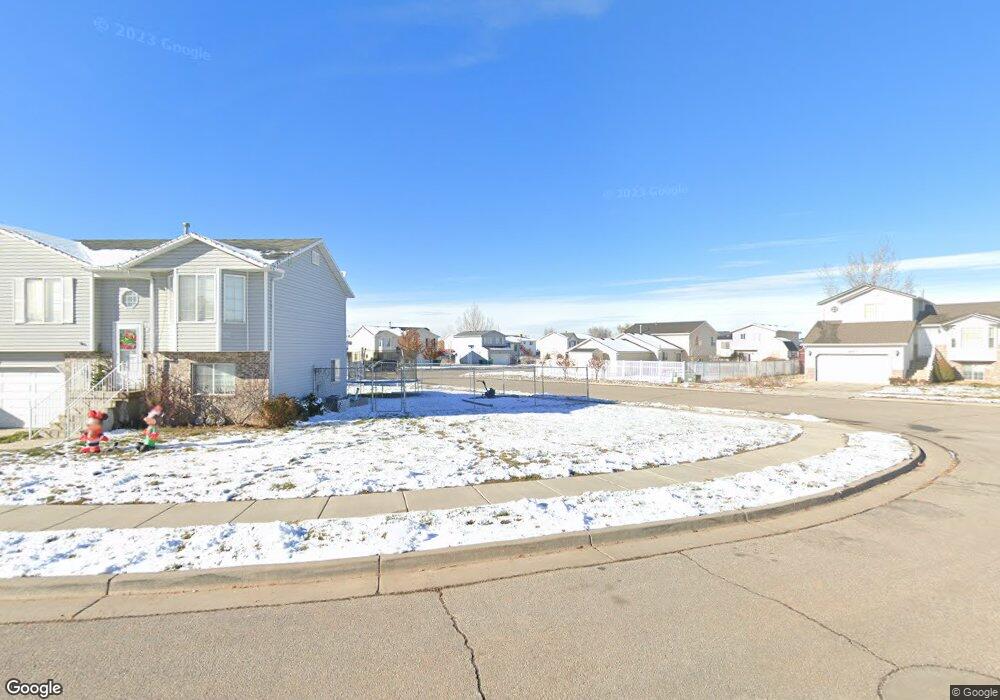
This home is located at 5361 S 4225 W, Roy, UT 84067 and is currently estimated at $406,984, approximately $252 per square foot. 5361 S 4225 W is a home located in Weber County with nearby schools including Freedom School, Roy Junior High School, and Roy High School.
Ownership History
Date
Name
Owned For
Owner Type
Purchase Details
Closed on
Apr 14, 2020
Sold by
Thompson Eric
Bought by
Thompson Eric and Thompson Brittney J
Current Estimated Value
Home Financials for this Owner
Home Financials are based on the most recent Mortgage that was taken out on this home.
Original Mortgage
$250,381
Outstanding Balance
$220,960
Interest Rate
3.2%
Mortgage Type
FHA
Estimated Equity
$186,024
Purchase Details
Closed on
May 11, 2010
Sold by
Christianson Tyson G and Christianson Jennifer S
Bought by
Peterson Jason B
Home Financials for this Owner
Home Financials are based on the most recent Mortgage that was taken out on this home.
Original Mortgage
$147,907
Interest Rate
5.5%
Mortgage Type
FHA
Purchase Details
Closed on
Dec 29, 2000
Sold by
Gmw Development Inc
Bought by
Christianson Tyson G and Christianson Jennifer S
Home Financials for this Owner
Home Financials are based on the most recent Mortgage that was taken out on this home.
Original Mortgage
$131,219
Interest Rate
7.71%
Mortgage Type
FHA
Create a Home Valuation Report for This Property
The Home Valuation Report is an in-depth analysis detailing your home's value as well as a comparison with similar homes in the area
Home Values in the Area
Average Home Value in this Area
Purchase History
| Date | Buyer | Sale Price | Title Company |
|---|---|---|---|
| Thompson Eric | -- | Us Title Ins Agency | |
| Thompson Eric | -- | Backman Title Services | |
| Peterson Jason B | -- | Mountain View Title Ogden | |
| Christianson Tyson G | -- | Bonneville Title Company | |
| Gmw Development Inc | -- | Bonneville Title Company |
Source: Public Records
Mortgage History
| Date | Status | Borrower | Loan Amount |
|---|---|---|---|
| Open | Thompson Eric | $250,381 | |
| Previous Owner | Peterson Jason B | $147,907 | |
| Previous Owner | Christianson Tyson G | $131,219 |
Source: Public Records
Tax History Compared to Growth
Tax History
| Year | Tax Paid | Tax Assessment Tax Assessment Total Assessment is a certain percentage of the fair market value that is determined by local assessors to be the total taxable value of land and additions on the property. | Land | Improvement |
|---|---|---|---|---|
| 2025 | $2,410 | $378,300 | $120,013 | $258,287 |
| 2024 | $2,352 | $372,000 | $120,013 | $251,987 |
| 2023 | $2,284 | $362,000 | $119,941 | $242,059 |
| 2022 | $2,517 | $415,000 | $105,008 | $309,992 |
| 2021 | $1,937 | $286,000 | $80,017 | $205,983 |
| 2020 | $1,901 | $259,000 | $80,017 | $178,983 |
| 2019 | $1,792 | $229,000 | $45,015 | $183,985 |
| 2018 | $1,722 | $207,000 | $42,015 | $164,985 |
| 2017 | $1,612 | $181,000 | $42,015 | $138,985 |
| 2016 | $1,554 | $93,826 | $21,415 | $72,411 |
| 2015 | $1,330 | $81,021 | $21,415 | $59,606 |
| 2014 | $1,221 | $72,566 | $18,736 | $53,830 |
Source: Public Records
Map
Nearby Homes